I've had a lot of emails today about the gold miners, GDX or the 3x leveraged ETFs, NUGT and DUST.
I went over GDX a bit I believe last night or Tuesday. Here's what I have so far with some open GDX calls and a NUGT long which is what I prefer and may even add to it.
This is the price pattern I'm looking at now, an inverse H&S bottom, I'm looking for a breakout above the neckline, that's for starters.
Tis is the daily chart, you can see there was a defined range and that was hit with a run on stops, I believe it's a head fake move. The next day we have a solid bullish reversal Hammer candlestick and today is like a star so far, we'll see how it closes.
This is the same area on a 60 min chart, the red trendline is resistance seen above as former support and something like an Ascending triangle, although it's not a true Asc. triangle because of the lack of a preceding up trend. In any case, the short term is a little rough to determine, the charts aren't screaming there so I'm using the most obvious market behavior and looking for a head fake move just under the triangle's support before a breakout above the trendline, if there's a good time to start a new position or add, that would be it so long as there's good accumulation on the move, so I'll be setting price alerts looking for that move and a Break Out move above the trendline (resistance),
The white arrows are support (bullish hammers", the red is the run on stops; the others are the hypotheticals.
Here's the 5-day chart with a large complex H&S top. Technical Analysis expects at least 1 test of resistance once the neckline of the H&S is broken and technically that could be considered that little area around late March. However, as I explained the other night and a couple of times this week, there are only 3 places I'll short a H&S top, that's: 1) At the top of the head, 2) At the top of the right shoulder and 3) after everyone else has jumped in short on the break of the neckline and also at the failed test of resistance (March), then the most common behavior is for a shakeout of the shorts with a counter trend rally that moves above the neckline of the large H&S top which squeezes out most shorts. For good measure this move often bumps just above the far right shoulder to squeeze all shorts out and right as that rally is about to fail and turn back down for the real decline, that's the 3rd and last place I'll short a H&S top.
Look at the volume alone recently, it looks like huge capitulation over a long period, almost selling exhaustion, whatever you want to call it, if has offered GDX very cheap and in huge supply, two things Wall Street needs to accumulate for that head fake/shakeout of the shorts.
As I said, the intraday charts are kind of "blah " right now, the 5 min is the first clear chart among the fastest timeframes and it looks like it could see that head fake move I suggested below the triangle just before a move to the upside as about 80% of reversals have some sort of head fake move just before a reversal. To understand why, see my two articles linked on the top right side of the member's siite called, "Understanding the Head Fake Move".
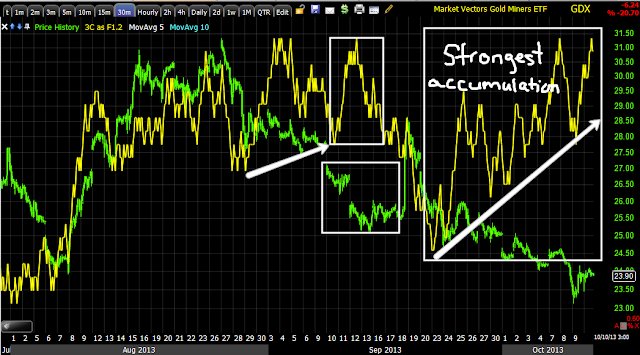
The 15 min shows the concept I showed earlier in the week in which the area (to the far left) where accumulation first starts) is almost always well exceeded by the time the upside move is done, even though accumulation in to lower prices reduces the average position cost, in my experience the following move up almost always far exceeds where accumulation first started as we can see above (to the left at the first acc. range). The current positive divegrence is leading and even stronger and this is how these divergences in larger patterns typically proceed.
On an important 30 min chart (larger flows of funds) we see the same accumulation move to the far left as the example above on a 15 min chart. Also the larger/stronger positive divergence continues to the right in an area that clearly looks like a bullish inverse H&S base.
The 2 hour chart is the largest flow of funds, the signals here are the most important and we have accumulation at the June lows followed by a rally in to August and a larger leading positive divergence now.
As I have said several times this week, the longer term charts are like the chest with the promise of a strong move and the shorter intraday charts are like the key to unlocking that chest.
I like GDX/NUGT long here right now, but I'd like them better ion a small confirmed head fake below the triangle for a day or so, I'd like to add, but whether I do or not, if I see the move I'm, looking for, I will post GDX/NUGT as a new or add-to position.
Is interest rates about to start going up?
-
Yes, I know - it does not make any sense - FED is about to cut
rates...but....real world interest rates are not always what FED wants it
to be.
6 years ago


No comments:
Post a Comment