Currencies are an important part of the market with almost no US macro data (we're looking to China for economic data) and of course the government debacle, I don't need to say how important that is,
but this may be why the duration risk looks so pronounced to me, perhaps it's the market's reflection of it about top throw a fit, but then rally on the initial news of the default being avoided and make no mistake, I DO NOT think Obama is going to let his legacy be that of the president who oversaw the U.S. as the full faith and credit of the US washed down the tubes with default and let that overshadow his healthcare triumph which has been a Democratic race to be the first to get it done (remember Hillary Care?).
This is hypothetical, but an initial tantrum by the market followed by a brief relief rally and a sell the news event is something that would make sense with a lot of charts, it would be a kind of delayed sell the news just like QE3 was a delayed "Buy QE3", I am not comparing duration in this case, just behavior.
So as far as currencies, the JPY looks strong enough with underlying trade and a price range that I don't think any of the carry crosses will be much help, the Euro got pounded on the German Zew business sentiment today, it may see a dead cat bounce, but I think it takes longer for it to put anything sustainable together.
The $AUD looks to be topping here and soon to roll over.
The $USD has a nice bull flag from early this morning, but it doesn't look like very strong probabilities it holds or adds much to it as far as carry crosses go and the main problem is the JPY itself.
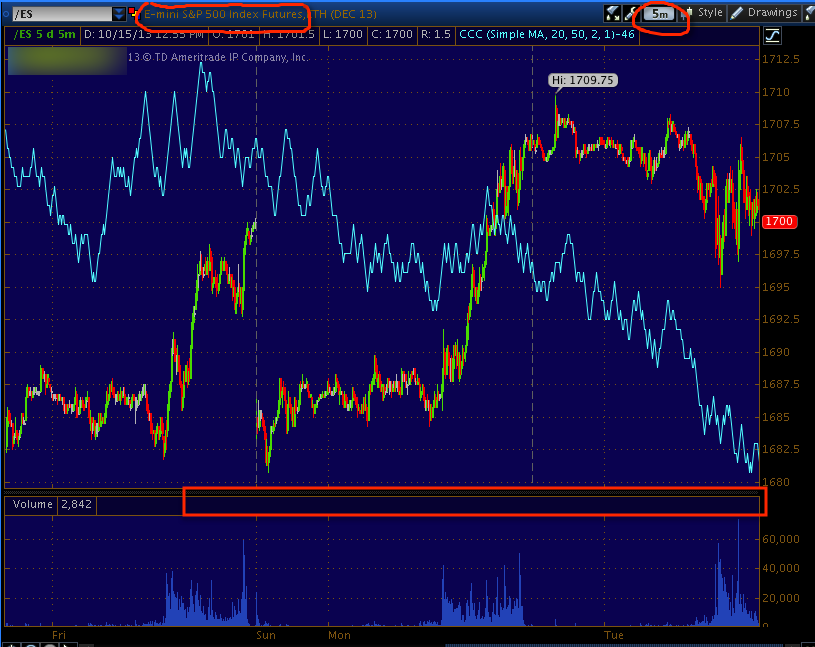
The Index Futures look like this...
I didn't want to draw on this chart because I think it loses some effect. You may recall it was Friday afternoon around 2 p.m. that the first negative divergences started peaking out which would be about the time the market starts to do what it wants as the op-ex pin from the weekilies is just about all wrapped up, the signal has just grown worse since and is quite ugly.
I posted the NASDAQ futures this morning and they haven't changed much.
R2K Futures have seen significant deterioration overnight and in to regular hours today, so much so that there's been migration from the 5 min chart above...
to even the 15 min chart. Look at the divergences on the 16 min R2K Futures, it goes positive last week and we see that strong 2-day move on the upside, now we are seeing a leading negative from a relative negative.
The TICK charts have been deteriorating since the signals started late Friday...
This is my Custom Indicator for TICK vs SPY with a sort of MACD Histogram of the differential instead of using the differential of two moving averages, today is clear.
I looked back a ways, although it's harder to see (that's why I lifted the first arrow so it doesn't block the data) and this is the sharpest drop off in TICK on the chart, although the previous one lasted longer.
This is the 1 min NYSE TICK data for the last 2 days, you can see trends in the data that align with price, it's divergences that are important.
TICK data is the number of all NYSE stocks that are advancing that single bar minus all that are declining, it's a breadth indicator. Obviously as price moves up like yesterday's IWM high, you expect to see more stocks moving higher, but here we see a trend of fewer stocks moving higher and more moving lower. The upped and lower limits are considered to be extreme levels.
This is a simple intraday SPY Oscillator screen, momentum is negative, RSI is negative, MACD is negative and Stoch is as well.
This is about as close as I can get you to the EUR/JPY carry trade that was supporting the market before. Yesterday I showed you the charts of the Yen likely to stop cooperating and move higher or at least refuse to move lower and of negatives in all the crosses, but even 3C couldn't predict the depth to which the Euro turned negative after the German business confidence (ZEW) came out today.
Yesterday I showed how VIX futures were being bid for protection enough to cause a supply/demand disruption and keep the VXX from falling as it should have vs this inverted price chart of the SPX. Today it's far worse as VXX is leading significantly.
Sentiment has been peeling away, this is not Stocktwits, these are the pros.
HYG which I also warned about is now peeling away from following the SPX to highs and making a new low.
I showed you HY Credit last night, not much improvement there.
However for all of this that is negative, there's a lack of REAL INTENSE negative, that's probably part of that duration risk that has me on the sidelines right now with what I already have. If something changes, then I'll take appropriate steps, but this was expected to be a short duration move so I don't want to try to trade it like it's something the charts do not support.


No comments:
Post a Comment