- BULLARD SAYS THINGS ARE LOOKING BETTER
- BULLARD SAYS JOBS PICTURE LOOKING BETTER
- BULLARD SAYS QUESTION IS WHETHER JOBS PICKUP SUSTAINABLE
- BULLARD SAYS A STRONG JOBS REPORT FOR NOVEMBER WOULD INCREASE PROSPECT TO TAPER IN BOND BUYING IN DECEMBER
The tine is clearly Taper On and maybe as soon as December where most have been betting, but most have been wrong most of the year. In any case the market didn't like it which came right after the ECB floated negative deposit rates again and sent the market a little higher. My question still is what does all of this mean if anything, for the 2 p.m. minutes because the mixed messages don't seem to be trying to inoculate the market against anything in particular.
I called for this bounce based on charts, nothing else and I'm sticking with charts. No matter if I post all 4 major averages and HYG Credit, the bottom line is still pretty much the same and I think the 3C ES 5 min displays it the best.

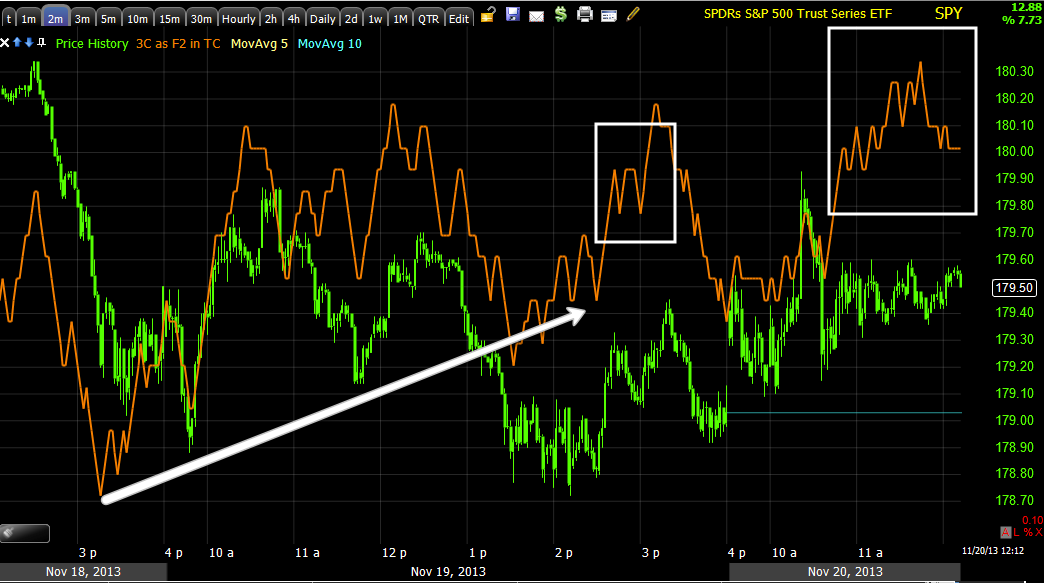

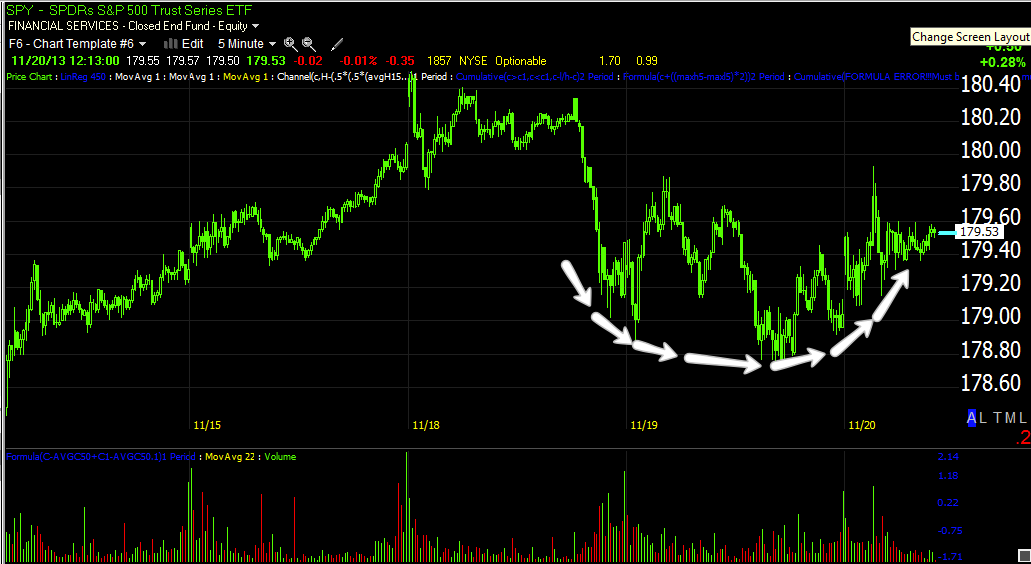


Pretty much across the board, the more important 10, 15 min + charts are negative so that's another cap on the bounce anticipated.
However as I said yesterday, "Wall Street doesn't do anything without a reason" and they did this, if it was obvious to us Friday, then Monday and then yesterday in which we can predict the next day based on the charts (as well as the longer term trend), they are behind it.
The question is why and typically as I reminded you, these moves are rarely mediocre, they are there to cause movement and to do so they must move emotions.
I'm thinking any "real" price strength we "may" or should get, would be where I want to short in to price strength, re-open VXX calls and enter Puts and shorts.


No comments:
Post a Comment