I don't expect volatility will lighten up much with tomorrow's ECB meeting. Inflation has fallen to .7% and last time that happened in November Draghi cut to a record .25% so some easing from the ECB seems to be the market's expectation, that could cause some real volatility in the early morning hours.
Once again yesterday's Dominant Price/Volume Relationship called today's close again which it has done for the last week every time we've had a Dominant theme. We do have a Dominant theme again today, but it's hard not to with yesterday's large volume so this one seems to be more a result of yesterday's volume than today's action, but the theme is Price Up and Volume Down which is the most bearish of the 4 possible relationships with 15 of the Dow, 62 of the NASDAQ 100, 866 of the R2K and 296 of the S&P-500. Typically this represents a short term overbought situation and the next day usually closes down, however once again, yesterday's large volume looks to have skewed today's results.
As far as what I see as pretty simple divergences and correlations... The basic correlation to understand is the USD/JPY (or any of the JPY carry crosses) vs Index futures, they move together.
Today's afternoon 3C signals were interesting considering the close/relationship and the market after the close, 3C seemed to pick up on something.
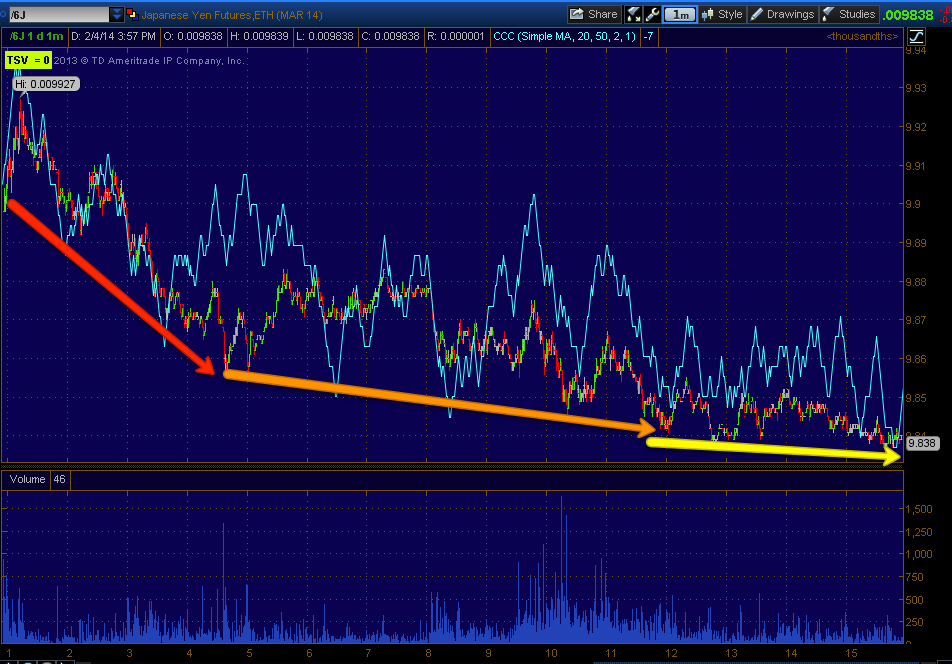
You can see the Carry Cross (currency) vs SPX futures on this 1 minute chart, however in to the close we see ES break down below the correlation, we've seen this going both ways at least 5 times in the last week and it tends to be telling.
We try to use 3C on the carry trades but don't get great signals, but often legible.
intraday the 1 min 3C chart was in line with the USD/JPY moving up, then in the afternoon note the negative divegrence even as price moved higher, ES and the market averages seemed to pick up on the 3C signal in the carry cross, not the price action, of course they are expert tape readers.
(*Try to ignore the hockey stick shaped yellow line to the left/bottom) Here I'm just showing how the market jiggles and to the right, a straight move up would look awfully strange, I do suspect a pullback to form a "W" base in the market as I've said today and that should include the USD/JPY, that would be in keeping with a more normal character. The 3C signals here show distribution to the left before prices move down and accumulation at the lows, this is where I suspect the USD/JPY is heading and as I said, the correlation should create a "W" base in the market averages as well which is something we talked about in last night's "Wrap" as a possibility as the "U" shape was too tight.
To better predict the USD/JPY, I use 3C on the individual currencies that make up the USD/JPY pair. Note for correlation purposes, if you are long the USD/JPY you are long the first ticker, USD and short the second, JPY. So, you could say (
in this case, not using the historical legacy arbitrage) that a weaker Yen pushes the market higher, a stronger Yen pushes the market lower and vice versa, a strong USD pushes the market higher and a weak $USD pushes the market lower because that's how they effect the USD/JPY carry.
So looking at the individual currencies to get a better idea.
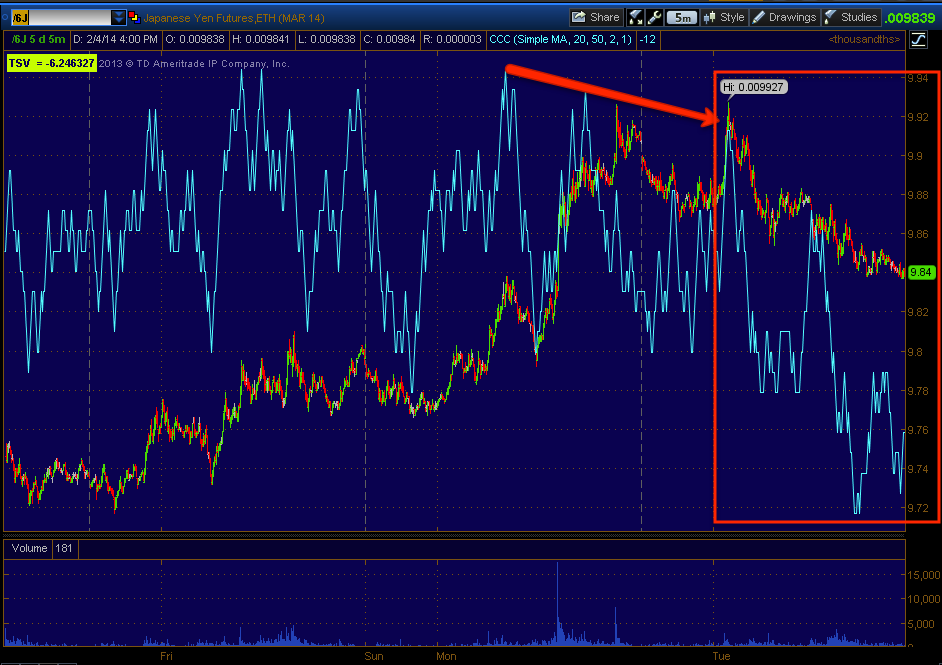
While the 1 min 3C chart of the Yen today is not positive, the downside ROC to a flatter trend is short term positive for the Yen, suggesting near term downside for the carry pair and the market or Index futures overnight or near term.
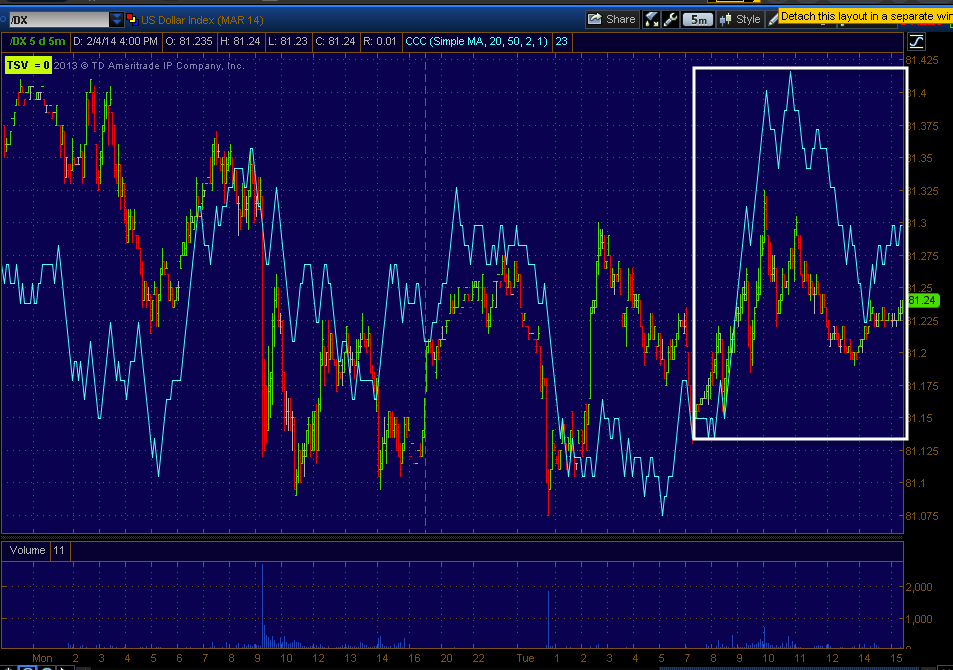
The 1 min $USDX is also trend-less so the edge goes to some market weakness nearby which we say right after the close
The stronger and much more important 5 min Yen chart has been negative suggesting the market see some strength near term as in I'd say tomorrow.
The $USDX 5 min chart is positive so that is confirmation and also hints at market strength nearby as 5 min charts can last overnight and in to the next day unlike 1 min charts.
Even the much stronger 15 min Yen has a negative divergence and...
The 15 min $USDX has a positive divegrence so this suggests more than just a little strength, this is along the lines of the bounce breakout above last week's range in the market averages.
The VIX or FEAR INDEX trades opposite the market, today we had weakness in the VIX on some market strength. However rather than using the spot VIX for my analysis I like to use either short term VIX futures like VXX or actual VIX futures.
This 1 min chart of VIX futures shows a late day positive divegrence, whatever 3C was picking up and going negative on in the afternoon, VIX futures were going positive, this is confirmation between the market and VIX futures, but still short term as in intraday.
The more important 5 min VIX futures chart shows a clear leading negative divegrence, if there were a lot of fear in the market (even though VIX futures are up in price), we'd see very strong accumulation, instead we see what I can only say is a rotation out of safety and in to risk assets (sell VIX high at a profit and enter market averages low expecting them to move higher).
The 15 min VIX futures has a very strong negative divegrence as well, in fact this is one of the strongest I have seen this year.
Intraday VXX (blue) performed as it should vs the SPX (green) which I inverted (price) so you can see the correlation as they normally trade opposite of each other.
The strong 5 min VXX 3C chart is also in a leading negative divegrence again suggesting the market is about to make a strong move to the upside. This is the kind of chart we did not have yesterday and the reason I had no interest in a VXX short, however today it looks better and if three's a chance tomorrow I may very well open some sort of VIX short.
Interestingly, just as the market put in a bunch of bullish Harami reversal candlestick patterns today, the VXX also put in a Harami reversal, but a bearish reversal being it trades opposite the market, however what is interesting is my custom DeMark inspired Buy/Sell indicator gave a long signal for the DIA and a short or sell signal for VXX and we've had good luck with these signals, especially on VIX.
VXX daily sell/short signal
DIA/Dow Daily Buy signal on yesterday's low.
As for Index futures.
ES was giving a fairly negative intraday signal near the close and lost ground right after the close.
NQ 1 min was as well
And TF was very clear about a negative signal, the market averages were also giving negative signals, I think it had something to do with the negative signal in USD/JPY 1 min.
Another Indication of the rotation out of safety and in to risk seems to be clear in 10 and more specifically 30 year Treasury futures and TLT.
Intraday the 1 min 30 year futures had a slight positive divegrence , but that makes sense with what we saw at the end of the day and this is not likely to do much more overnight.
The 5 min signal though should hold well and it is clearly leading negative suggesting (like the VIX futures) there's a rotation out of safety and in to risk instruments, remember Institutional trades are much bigger than ours, they can't put a position on or take it off with one transaction, it can take days, months and even years depending on how big it is.
The 15 min 30 year futures are an even stronger signal depicting distribution, which is also good for our long term trend positions as I'd love to go long TLT on a decent pullback which these signals seem to suggest quite clearly we will see in Treasuries.
Intraday TLT was in lock step with the SPX (I have inverted the SPX's price so you can see the correlation as they trade opposite each other).
Remember the NKD (Nikkei 225 futures)?
The 5 min chart remains positive and we have what looks like an inverse H&S bottom in the Nikkei 225 futures.
The 15 min chart saw a VERY strong leading positive divergence today so I suspect the NKD will see upside, in line with the US markets.
As for the IWM...
Charts were clean and clear today then started to get sloppy in to the EOD negative divergences that started in the afternoon as you see on the 1 min IWM today.
However I always say, when things get messy, go to the longer term charts to reduce noise and see the trend.
The 15 min IWM has a positive divegrence through last week's range as I suspected we'd see Friday the 24th, the move below or head fake move which was from last Friday's post, "Come Monday" also has an impressive leading positive divegrence.
This is what I mentioned yesterday and suspect we will see tomorrow...
The SPY Harami (almost every major average has some version of this bullish upside reversal candle pair) is textbook, the most common 3rd candle or confirmation candle opens lower/gaps down the 3rd day and then closes above today's close creating a bullish engulfing candle and confirming the reversal pattern.
For VXX we would expect to see a gap up (which we may be able to use to sell short in to or open Put options) and close below today's lower close.
This movement intraday would create the "W" base I've been talking about today and last night as the reversal process seemed a little too tight.

Here's the SPY with a presumed head fake move below the range, the range makes it highly probable we'd see a head fake move on top of the already 80% probability because the range defines an area where shorts will enter and stops will be placed. However, there are few "V" reversals or event reversals, most are a process and even this one would be fairly tight. The "U" shaped reversal originally expected was distorted today by market upside too soon, this now has the look of the mid point of a "W" bottom. A gap lower in the morning would likely put us somewhere near the yellow trendline creating the "W" base from which we can complete the reversal process. *Note that head fake moves are seen on all timeframes and frequently so even a small "W" base like what I am proposing would have a high probability low a bit lower than yesterday's as it hits stops and new short orders as a lower low, that's what gives it the momentum as it moves up and new shorts are squeezed creating a "Failed move creates a fast move" snowball effect.
As far as Leading Indicators today, HYG was mostly in line, but a little weak in to the close which is not surprising given the late day signals. Sentiment is actually looking more bullish now as a leading indication.
Sentiment has been largely flat or in line, this is much more bullish than recent readings the past week.
HY Credit was in line today with a slight positive which means something because it's usually the first to break and run on uncertainty. Yields are in line so nothing interesting there.
I'm not sure the Dominant P/V means much for tomorrow because of the large volume yesterday. Otherwise it seems we have quite a few positive signals and correlations. I would like to see the 5 min Index futures improve more, but if we are to see a gap down open, it would be normal for them to be a bit weaker as they have to hold overnight. The 15, 30 and 60 min Index futures each have at least one leading positive, which also indicates larger bearish trend or character in dispersion which was unheard of a year ago when everything moved exactly the same, now even on a less volatile day we still have a difference with the Dow closing up +.46 and the Russell 200 almost doubling that at +.85%, but that's for the next bridge we cross.
I didn't see much point in trying to enter new long trades today suspecting a move lower on the open, that would be the time after we confirm accumulation of a move lower. It will be interesting to see what the Nikkei does tonight.
I think that about wraps up the day and what we are looking for tomorrow, perhaps a short in VXX if we get a market gap down and a VXX gap up and perhaps some long equity positions on a gap down as long as we still have strong 3C signals in the averages and in the Currencies which seem to be the most important indication.
As of right now, the Yen is seeing some strength off the loss of downside momentum on the 1 min chart, we'd need a move like this to create a gap down in the a.m.
I'll check futures before turning in and let you know if anything has changed,
don't forget if you entered the AAPL put with me, I'm looking to close it on downside momentum pretty quick, this is meant to be a short term trade only, I'm not bearish on AAPL for a bounce move.


No comments:
Post a Comment