I have a few different charts for you tonight as today was a different day.
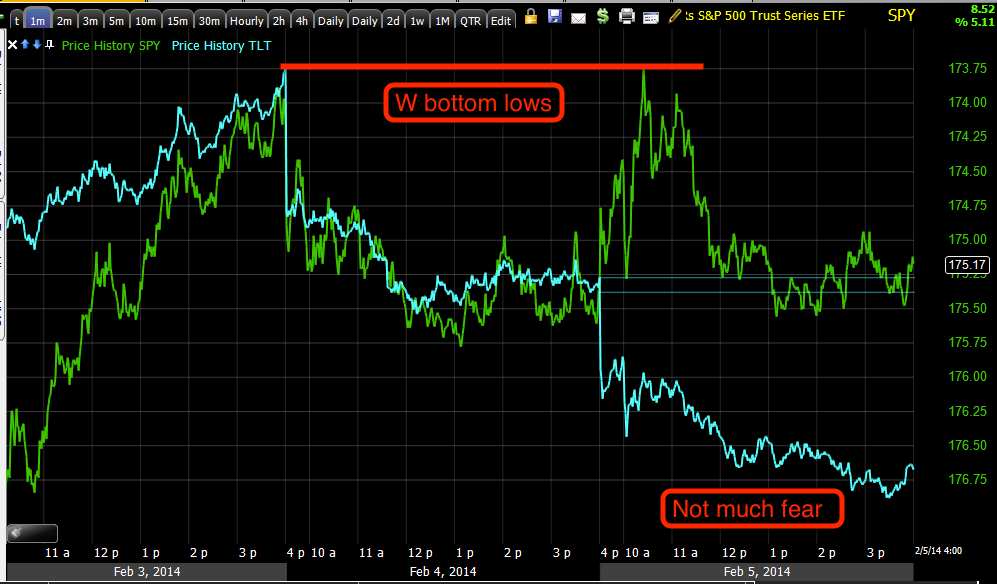
We did get the anticipated "W" price pattern (a common base) which I think is pretty impressive being that was predicted completely with 3C signals and understanding market psychology, really the market could have done a number of different things.
We also got a bunch of decent closing candlesticks, although not the strong bullish engulfing that I had hoped to see with a strong gap down and strong close up, but it may be the market is in a holding pattern for a couple of different things, tomorrow's ECB policy announcement would be the most obvious as there seems to be some expectation of easing from Draghi. There's also the weekly Initial Claims that could become a catalyst of sorts. However if anything, I'd think a move up is more just for the tactical advantages Wall St. needs because of their size. If you want to have some fun, look at the 1929 market crash and just after, look at the extent and strength of the 6 month counter trend rally just after the initial crash, most people don't see that and I think few would be able to stay short the 1929 market after that initial counter trend rally. As far as retail sentiment goes, as I said, "Buy the dip" has been replaced with "Sell the rip", even though we haven't had one. The point being, retail sentiment is firmly bearish now and a good shellacking would set up quite a few opportunities for Wall St. and us.
Last night's lack of a real Dominant Price/Volume Relationship seemed to fit perfectly wit the market's performance for the most part today, pretty blah.
Tonight's Dominant P/V Relationship is just as "Blah", first off there really isn't one, only 1 average of the four has a theme that's close to dominant and the others are mixed, but if I had to say what it is, I'd say,
"Price Down/Volume Down". Other than being the domiant theme associated with bear markets, it's the least meaningful of the 4 possibilities, it actually has no real bias for the next day so that in itself is interesting because we don't have a strong bias like Price Up/Volume Down which would suggest a close lower tomorrow.
In forming those candlesticks that looked pretty good today, we had a lot of tests of new 2014 lows that held, but we formed our "W" base right at them. The Dominant Candlestick today would be a bullish reversal Hammer in all of the major averages and in most it would also be a second Harami (bullish reversal pattern).
Lets get to the charts, they may be a bit disorganized.
These are mostly Breadth charts of one kind or another.
This is NYSE Advancers/Decliners (green) vs NYSE (red), if you click on the chart and look closer, you can see our range from 1/27 at the yellow arrow and you can see that the A/D line has held up much better than price which is short term bullish. At the red arrow we see where the A/D line lagged price and at the green arrow where it led or is leading.
I mentioned this last night, the "Percentage of NYSE stocks Above their 200-day Moving Average" in green vs the SPX in red. Note how they have hit a new percentage low for the year. The standard deviation versions (momo) are much worse, this is something for the longer term trend in the market. It's amazing to look at the trend and see the percentage drop from 81% to 75% to less than half at 43% right now,
this is an extremely hollow market, thus the volatility and when she really breaks, it's going to be bad because the structure of the market just isn't there.
I have a Breadth Layout for the NASDAQ 100 intraday, I thought we'd look at the "W"
Today's completion of a "W" base shows strong momentum indications in to the second area, this is where we also have good 3C readings that are stronger as well.
This is a breadth chart, it's the "% of New NASDAQ 100 Highs on a 250 bar basis vs. New Lows". As you can see, even though the NDX made a slightly lower low today, fewer stocks made new 250 bar lows and more made 250 bar highs.
This is the Percentage of NDX component stocks Above or Below their 50-bar average at the "W" area, you can see there are fewer below their 50-bar at the second low and more above, it's not huge, but considering it was a lower low for the NASDAQ, it is worth noting.
The Advance/Decline Ratio is pretty clear and like the other breadth charts, shows a stronger low today than the first which is what we want to see in 3C as well and have.
Leading Indicators...
This is TLT vs the SPX with the SPX's price inverted so you can judge the normal correlation to the left and the strong underperformance of TLT today. Again, we have seen this pullback in Treasuries coming and I welcome it as I'd like to be long TLT for a long term trend trade. The only reason I can think of that a Flight to Safety trade would be moving down in what is widely perceived as a very bearish market is if there's rotation out of safety and in to risk on an expected bounce.
This is one of our sentiment indicators, it is at least in line and not bearish, this is not a retail sentiment indicator, it's more "Smart money", there doesn't appear to be much near term fear there.
This is the second one we use, again, there appears to be no fear of near term market downside.
This is High Yield Credit which is an institutional risk asset and this version is very thin so it's usually the first to panic and drop or rise fast, this has gone from in line with the market to pretty much neutral to a more bullish stance today in the "W" area as it appears to be seeing upside from demand as it is thin.
There also appears to be accumulation since 1/27...
30 min HY Credit...
High Yield Corp. Credit which is VERY liquid put in a positive price divergence today as it usually moves with the SPX, but didn't at the market price lows today.Remember, I saw something I liked in HYG this week an opened a Call position.
While there are several 3C charts that impressed me, here's today's...
HYG is often used by Smart Money as a Risk On long asset, just look at the volume.
As far as the credit typed I can't pull up including HY17 and Investment grade, most of us have seen these charts the last several months and how deeply dislocated Credit has been to the downside vs the SPX in blue.
I think a quick glance at this chart shows a huge difference compared to what we are use to seeing, stocks have caught down to credit, but for the moment, credit is at a virtual standstill rather than trending down short term and looking carefully today, we see it's even moving up.
Yields are one of my favorite Leading Indicators because they are so effective and consistent and in any timeframe. Here's a macro view of Yields going negative vs the SPX and the resulting fall in the SPX until the two revert to the mean (green box), then a change in trend often takes place.
At our "W" you can see Y's are positive between the two "W" bottom lows or leading positive and even during this afternoon's flat trade area we see Yields continue to lead higher. Yields are like a magnet for equities, so this appears to be a bullish indication of not only the base low, but what came after.
Some charts of the USD/JPY...
It's difficult as you've seen to use 3C on USD/JPY futures so I'm using an equity version of them with Money Stream which is similar to 3C, it does the same thing. Here at an hourly chart top/flat range you can see MS making a negative divergence sending the pair lower.
If you look to the far right you can see a different divergence.
This is the divegrence I was talking about, positive at our base.
On a 15 min intraday chart, very positive for the Carry Pair.
This is a daily of USD/JPY with RSI, there's no doubt the carry trade is done and it will trend lower which should take the market significantly lower, more on that in a minute.
a 5 min chart of the actual USD/JPY (3C) shows the "W" area where we have had support 3 times rather than a lower low as we were making for all of 2014 until just recently. If you look close you see a positive at the first base, a negative at the high point of the "W" and another positive at the second base today, that seems to be a bullish / bounce signal in the pair and you know how Index futures / the market follow this pair nearly tick for tick.
While we are on currencies, the Yen...
The 30 min 3C Yen futures chart shows in line on the move up which pressures the market lower and a recent negative divegrence suggesting a Yen pullback allowing the market to bounce.
However, if you read my 2 linked articles on the members' site called "A Currency Crisis", back at last April when Japan's BOJ unleashed QE-Zilla, it was apparent then that it was a failure and nothing about that has changed, there are even noises from the IMF that Japan is looking for a premature exit from their ambitious QE. I wrote way back then than I see the Yen appreciating significantly and it should coincide with the market falling apart, so far for 2014 that has been true as the Yen bottomed the first day of 2014 and has rallied since pressuring the market, but this may be a quick bounce. However, the big picture...
A daily chart (3C) of the Yen futures with a HUGE positive divergence, I suspect this is a large part of the carry trade being covered as a bear market is anticipated, I still think the Yen heads much higher and the markets much lower at the same time.
Lastly the VIX
The Short Term VIX Futures (VXX) and my custom Buy/Sell signals with a sell signal triggered yesterday. This is the one I entered a put position in late today.
The actual VIX futures 1 min chart saw some momentum building in 3C and I saw it in VXX as well today, then when I said the market came alive near the close, you can see the VIX futures were apparently distributed.
Really it's this 5 min chart of VIX futures which has been a stellar chart for trading signals that is horribly negative, I think the worst I've seen for VIX futures. I suspect the same thing here as with Treasuries, a brief rotation out of protection and in to risk for a market bounce, just look at High Yield Credit.
In any case, I expect we will see volatility tonight although the day session was apparently very muted and I don't think it was coincidental because of the ECB tomorrow, it seemed that there simply was no underlying trade until they needed to near the close to keep things flat, that's the only time, otherwise I haven't seen a market like this very often, not in this volatility.
Sometimes the market is opaque and signals are all over the place, but today they simply weren't moving until it seemed they needed to near the close to support the market.
I do think the Nikkei 225 will be very interesting tonight, then we have the ECB's rate or policy decision, last time inflation sank to .7% like it is now, Draghi surprised the world with a cut to .25% Does he try some unsterilized QE perhaps? I think the market expects some kind of policy easing with inflation way below target.
I'll check in on futures before turning in and let you know if anything is out of the usual.


No comments:
Post a Comment