So far the market has not only made the price move expected today, but has also given the initial signals that move toward confirming a head fake move which is a big tactical advantage as failed price moves turn in to fast reversals although this would be a failed price move that was planned long in advance. Correlated assets such as VIX futures, Gold and some others (I still have a few to go through) are also confirming as is the price pattern which is distinctly a reversal process.
Here are the averages...
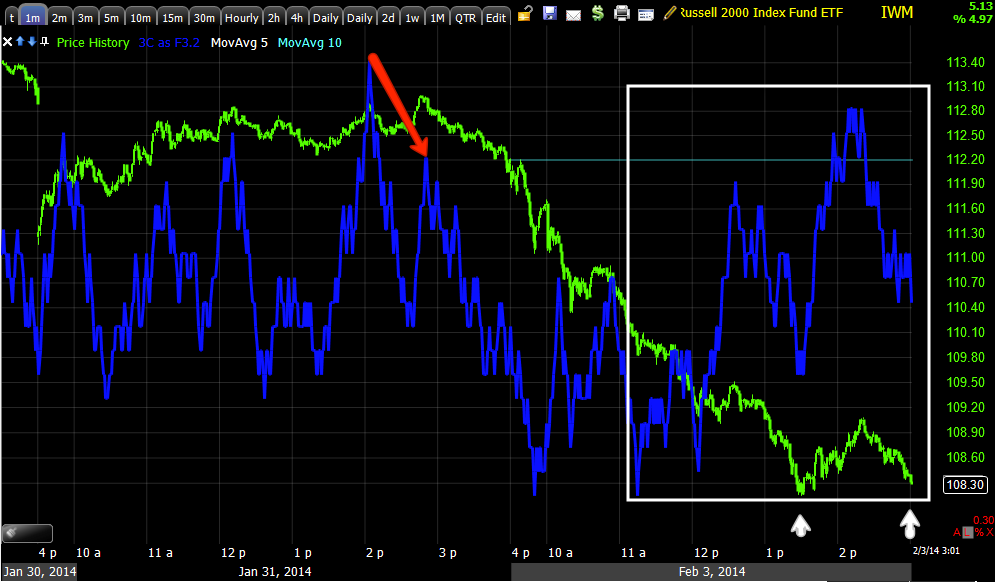
IWM 1 min which looks like it's near the bottom of a reversal process. First there has to be a move that changes sentiment to bearish and fearful, then that move needs to be reversed which takes some time so my estimate was "At least Monday" and maybe a bit beyond. However it looks like we are near the bottom of what would be the "U shaped reversal process. In fact at this mini "W", I'm expecting to see 3C make a significantly higher move (the indicator) which would be perfect and that's where I'd be most interested in starting or adding to equity/ETF longs.
IWM 2 min is showing less detail, more trend and at the bottom you can see the obvious change in 3C's character to the upside/leading positive.
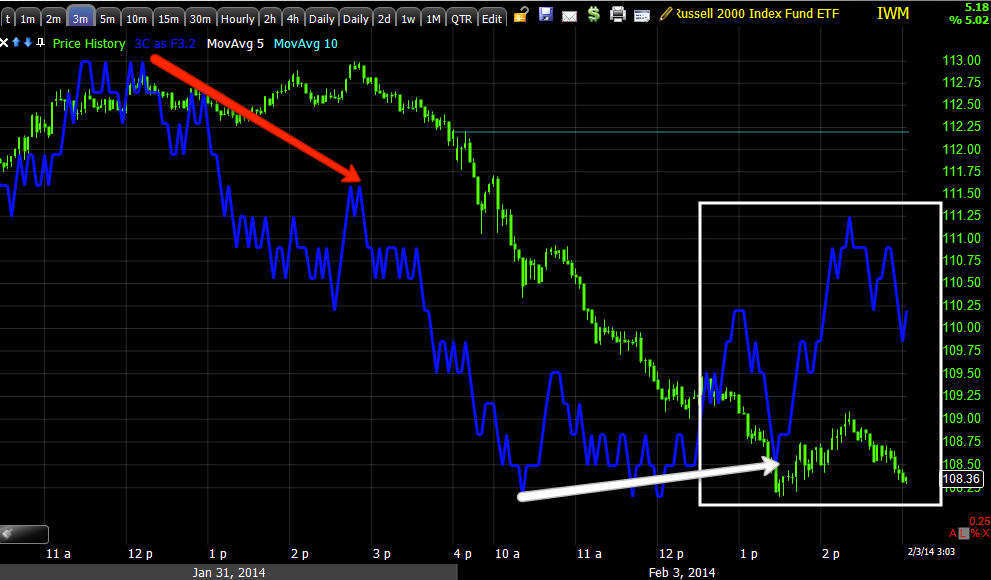
We also see the same as the divergence migrates to longer timeframes like this 3 min
The 5 min chart going leading positive (which has started) is where I feel comfortable adding equity long positions.
The larger picture 15 min chart shows there's no downside 3C confirmation because the price move is more severe, there's very little distribution, just enough to get price moving down, once it is moving down, then accumulation should take over in to lower prices, this is the hallmark of a head fake move.
QQQ as mentioned earlier lagged as it had further to go before it broke below last week's range so no accumulation would start until that was done which it was at the yellow trendline. Again we have what looks like a small "W" pattern which looks like it could be the bottom of the downside reversal process.
The 2 min chart is seeing migration of the positive divegrence so it looks healthy so far.
And the same is true of the 3 min chart
Now we are even getting the 5 min positive which is really the important crossroads, although I suspected this more than a week ago and so far it has played out so I can't say I'm surprised to see these moves confirming, but it is good to see.
SPY 1 min with the same "W" pattern area.
Even in a head fake reversal process, because the market is fractal, the small "W" we are looking at, at the bottom of today's "U" shape (first half) is likely to see a small head fake in which the second low of the "W" is lower than the first. This is why I say the market is fractal and these concepts are applicable to any asset in any timeframe.
SPY 2 min migration and the rounding process.
3 min leading positive with the same process.
And here's the 5 min, at the second base of the small "W" which we are at right now, we should start to see the positive divegrence take on an increased upside ROC.
Even the SPY/Custom TICK indicator looks like it is transitioning too.
As mentioned earlier, Short term VIX futures move opposite the market and here the 1 min shows a clear negative divegrence which should be the opposite of the market averages in the same timeframe so this gives us confirmation.
If I were interested in a VXX put, I'd probably consider it in this area, as fas as a short position in VXX, I think we can give it a little more time and suffer no ill consequences.
VXX 3 min leading negative as well
And the 5 min. So far we have excellent confirmation.
There are a few other indications I want to check including leading indicators and FX signals.


No comments:
Post a Comment