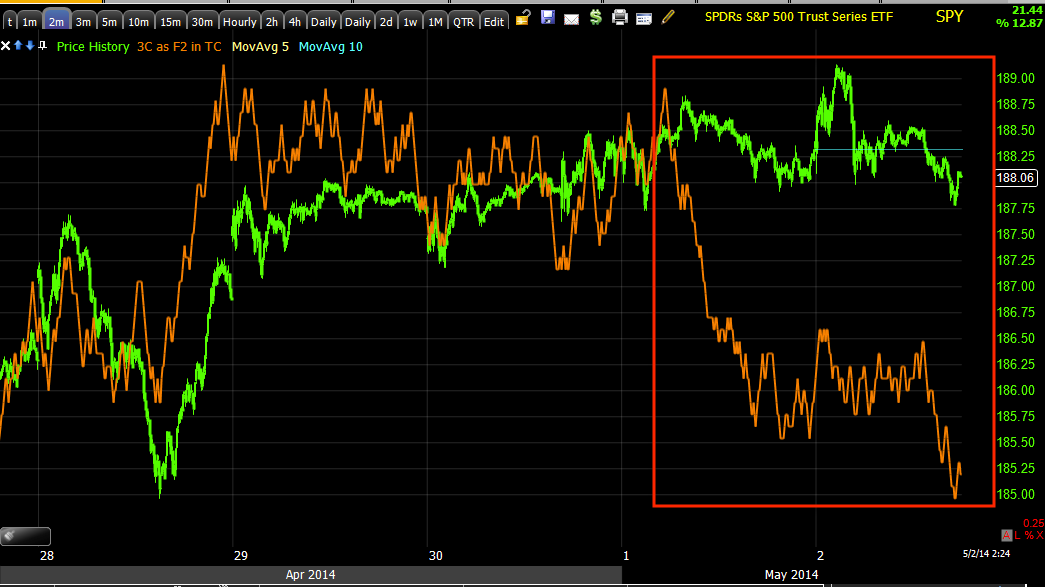
Considering what the VXX looks like (this is a VXX update from Wednesday April 29th) and the probable head fake move put in today, taken with these charts, I think the information that I gather the last two hours of Friday is pointing very clearly to a significant move to the downside in the market.
I said if I had a chance I'd put up some charts, here are some charts of the averages, I'm also looking at potential trades in several different assets, I like VXX or UVXY long a lot and there are several (actually many) others, but in most there's 1 nagging chart I'd like to see resolve.
In any case, if you look at the VXX signal trends and these, I think you'll agree, we are on the edge of a significant move down, not the noisy , volatile chop that has dominated for about 2 weeks now, but a real move that makes a lower low in an index like the NASDAQ 100 (I mention that one specifically because it had retraced the most (all of the Feb. rally).
DIA 1 min
DIA 2 min
DIA 5 min
DIA 15 min, this is the killer that's screaming new lower low.
IWM 1 min intraday
IWM 2 min
IWM 3 min
QQQ 1 min
QQQ 2 min, that's a lot of movement even for these faster charts.
QQQ 3 min trend
QQQ 10 min
SPY 1 min. -you see what I mean, this looks like it's ready to fall off a cliff timing wise.
SPY 2 min, another great example.
SPY 5 min
I'll be adding more as it comes up, I'm really trying to decide whether positions here are appropriate or a day more...the op-ex doesn't help
Is interest rates about to start going up?
-
Yes, I know - it does not make any sense - FED is about to cut
rates...but....real world interest rates are not always what FED wants it
to be.
6 years ago


No comments:
Post a Comment