As mentioned earlier, there were a number of assets I had looked in to from GLD which I'm virtually certain is coming down to inverse ETFs (even though earnings season is close to over) and numerous companies.
The Q's, near term have looked to be in the worst shape to me and for initial momentum with leverage, SQQQ looked pretty darn good vs. confirmationary signals in QQQ. 3C is interesting in that even though SQQQ is suppose to (and generally does) move exactly the same as the QQQ, except inversely and 3x leveraged), the difference in volume and size of trades can give you very different signals, I saw that earlier this week and declined to enter trades because I wasn't seeing confirmationary signals in GDX vs. NUGT vs. DUST except in one important place, the 10 and 15 min charts which all suggested GDX and NUGT which were at the high end of the range that day, would move below the range and it was just a day and a half later that this happened and these were the only 2 charts (10 and 15 min) that had confirmation between the 3 linked assets.
So I'm going to show you SQQQ (UltraPro 3x Short QQQ) next to the same timeframe is QQQ, there are some minor variations, but it's the underlying trend that I'm interested in, not small differences in noise.
SQQQ 2 min. with a rounding bottom and an increased ROC on the 3C leading positive divegrence as we go in to today.
Interestingly the QQQ 2 min looks a bit different but was picking up on the same increased ROC in 3C intraday signals with the mirror opposite leading negative divegrence (confirmation).
SQQQ 3 min, like VXX, I wonder if this is two distinct bases of one large double bottom? I suspect it is one large base because of the nature of the divegrence and how it is even stronger at the second potential bottom as is the case with "W" or double bottom patterns.
VXX is very similar as are many other assets.
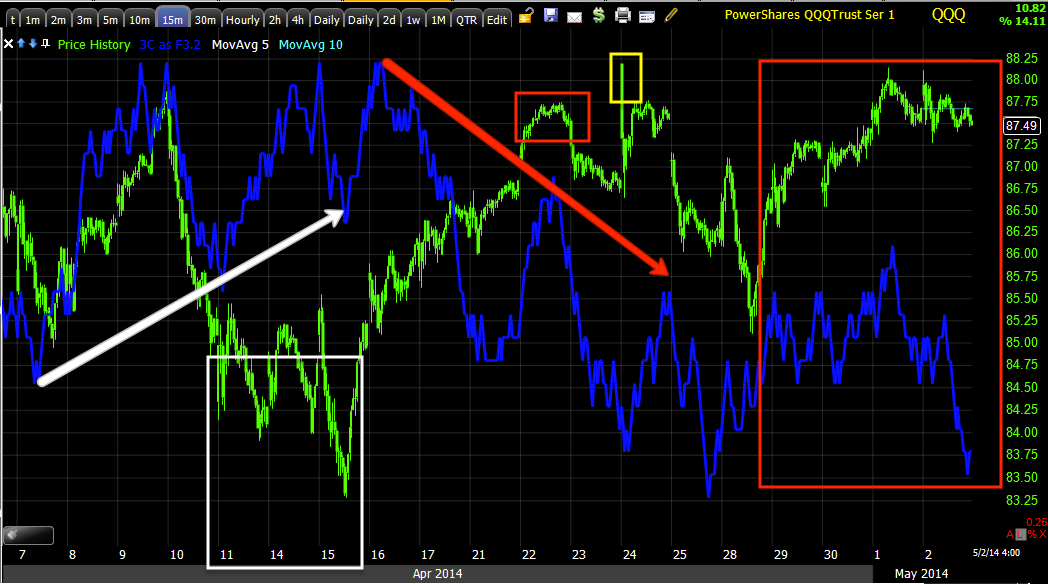
QQQ 3 min could generate the same question as distribution sent it lower around the 24t through the 28th.
We also have a stronger divergence, much stronger at the second top like SQQQ's second bottom.
SQQQ 5 min leading positive
QQQ 5 min leading negative and this is also around the same double bottom/top area.
SQQQ 10 min
QQQ 10 min
SQQQ 15 min
QQQ 15 min and below a longer look at the QQQ 15 min
Remember the 11th when we not only posted at the lows we'd see an upside move, but pretty much hit the target on the nose thus far before we saw the first day of price movement higher.
However, the deterioration in the Q's on this important timeframe is the real issue. Having the short term fast charts in line with these longer ones is what I call a full house and generally means a move is right around the corner.
SQQQ 30 min and watch the chart from left to right, from confirmation to leading positive divegrences and the possible double base.
Now look at the QQQ with the same confirmation to the left, the same deep divergence except distribution and possible two bases.
I also compared QLD and QID to SQQQ and QQQ for additional confirmation.


No comments:
Post a Comment