While this market has been very fluid all day, doing some things that Wednesday's Daily Wrap were not projecting, with the caveat that short term divergences that have not amassed any strength are much more likely to be run over when volatility picks up, but Wednesday's late day analysis wasn't based on divergences, it was based on a deeply 1-day oversold condition.
Note the IWM probed below the range's top, former resistance, current support and really the most important level right now for triggering the next strong move.

The IWM 1 min and intraday charts are showing a positive divgerence that is just working in now.
Here it is in the SPY 1 min and it's visible in the Index futures as well.
I don't think this can get any real upside, "Bounce" traction without forming a larger intraday base, price coming back down for a small double bottom or "W" bottom, without that I wouldn't call this anything more than intraday noise.
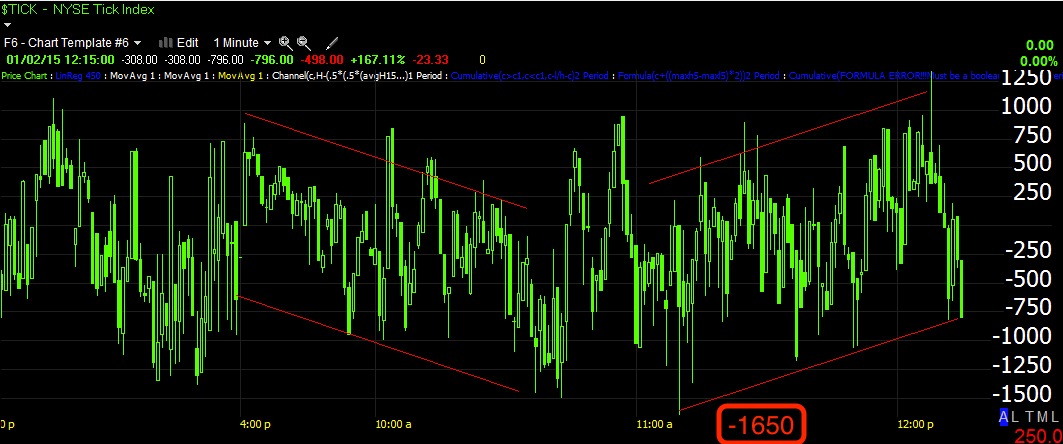
The NYSE TICK's trend changed with the recent move,
but before it did note the probe of the -1650 level, that's an extreme level and heavy selling. The NYSE TICK is all advancing NYSE issues less declining issues for the bar, so -1650 means 1650 more stocks are declining than advancing and that's an extreme selling level so there's real fear out there and it's palpable.
Still, without an adequate base, no intraday bounce will be able to hold out long or move far, especially with market sentiment right now as seen in breadth above (TICK).
While the market is moving to the downside, I prefer to just sit still and let my short positions works rather than chase price which usually tends to turn on you as soon as you enter. With any potential intraday bounce, you have some nice potential opportunities. For example, the 3x leveraged inverse ETFs of the major averages would pullback, offering a discount for an entry along with lower risk.
SPXU 3x short SPX
SPXU 1 min intraday negative, along the lines of the SPY 1 min positive.
However where it counts beyond intraday jiggles, this 5 min SPXU chart is showing some impressive 3C strength and nearby, meaning it's not some move in the future, in fact it has already begun so any potential entry is really a pullback buy in a great area.
The SPXU 30 min chart should speak for itself, compare the current positive to both the former positive and the negative that sent prices lower.
And as far as long term, this is the 2 hour chart is showing an obvious change in character on a timeframe that is well beyond a swing trade, this is core position material.
SQQQ 3x short/inverse QQQ which I've already featured, but as a reminder...
1 min SQQQ negative intraday
However a very impressive 15 min chart and...
And the SQQQ 2 hour chart is showing a very obvious change in character
SRTY 3x short IWM, this and SQQQ are among my personal core short positions.
Again like the others, the 1 min shows a small intraday negative, confirming the SPY/IWM charts above.
The 10 min SRTY with a very nice divegrence as the market hit the breakout area.
And the big picture, 60 min SRTY....
I think any of these would be a nice addition or add to as a core short position with some leverage, but not the concerns of options.


No comments:
Post a Comment