Everything today looks as expected with slight variations like we didn't get an early pullback to form a wider "W" base this morning before filling Friday's gap, but otherwise everything is right on track thus far and it's a matter of determining where/when the gas runs out. Can the market make that SPX head fake move? When are the most stocks on watchlists at the point of critical mass as far as Trade Ideas, etc.
Leading Indicators are calling today's move for what it is, a gap fill on unexpected news from China that likely left the middle men in transactions holding inventory at higher levels from Thursday's close and at a loss, thus in need of a gap fill, but I have mentioned the SPX clean, clear resistance trendline and head fake possibility which I'd normally put at an 80% probability ( a failed or false breakout which are excellent for entering put positions or other positions, I especially like it for options though). The 80% probability is based on years of monitoring of the market, seeing this concept happen in every timeframe and every asset usually just before a strong reversal in trend and I men just before which is also why it tends to be one of the best price-based timing indications for a price trend reversal (down in this case). However, as clean and clear as the SPX trendline is, it's hard to imagine an 80% probability, even though the larger the turn, the more probable a head fake, the market has just been that weak all year. You may recall that I've written numerous times, "I don't know how many times I've written the averages are green YTD or the averages are red YTD", which is something that happened to quite a few just on Friday's price action alone.
As for Leading Indicators, they are showing the kind of signals thus far I'd expect, you'd expect if you've spent a month or so looking at Leading indicator posts, in this circumstance of at least a gap fill from Friday which the market has been relentless about whether oversold/overbought or not, just something that has occurred with increasing frequency to almost the point of guarantee as HTF's have become more dominant in the market.
Another concept that has been strong is that of reversal candlesticks, especially on volume. You'll see on the Leading Indicator charts below, areas marked as last week's forecast "reversal process". Normally with a reversal process we have a price pattern that looks like an "Igloo with a chimney", the Igloo is something like a rounding top, part of the reversal process and the "Chimney usually comes just after the rounding top starts turning down and it is the head fake move that breaks above the top of the rounding price pattern and usually on non-confirmation, thus in this case if it were to occur, distribution which is how we know we can use the price strength and underlying weakness to enter positions and use the price strength to our advantage or use it to close a long at the best price.

To the right in the yellow box are two candles forming a bearish "Tweezer" top, as well as the second candle on the SPX actually an inside day or mini Harami bearish reversal, this is the area of the reversal process forecast for last week. Friday's candle has a longer lower wick, not the minimum 2x longer than the body that is the way to tell a "Hammer" bullish reversal, but it's the psychology of the concept, not anything unique about how long the actual wick is. This shows lower prices were rejected Friday, which came right after our afternoon flameout. The increasing volume makes this a much more probable reversal candle even if it's not a textbook "Hammer" bullish reversal in to today- the psychology of the candle is the same even if it's not textbook and the volume is the most telling part.
Leading Indicators. not strong, in line with today's expected move...

If you look close at the 'flameout area" from Friday afternoon, you can see small intraday support by the SPX:RUT ration as it fails to make the lower intraday low/stop run.
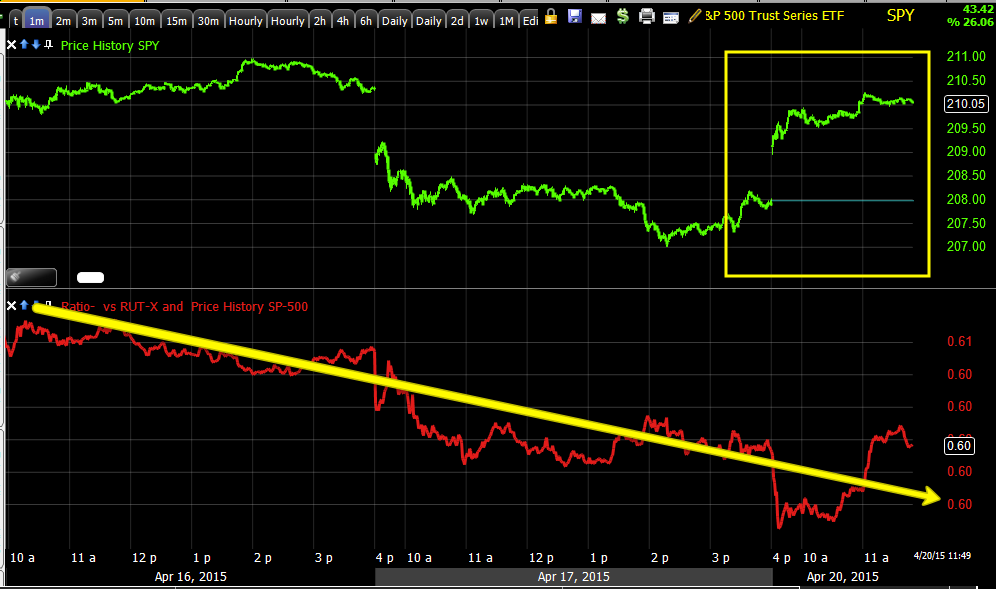


Indicative of the recent price moves, the custom TICK/SPY Indicator makes near perfect sense...

As for the averages... This is a near perfect example for all of the averages...

However, the strength was really built Friday on the flameout at about the 3 min chart area.


This is also fitting with the Leading Indicators.
I want to be careful not to waster possible head fake momentum, but also want to get the pivot point right, so it's a matter of watching these charts, how quickly they degrade, whether there's maybe some outside influence that could spark a head fake move as the charts themselves certainly don't appear to have the gas as they never build that stronger second low talked about Friday and you can see the result in the charts above.
It's just looking at the market and looking for the highest probability message or that glimpse of something that is rare toy see, but tells you a lot. Otherwise, I can't say this looks any different than if I were to have guessed at the most probable look to the charts Friday night.


No comments:
Post a Comment