"I believe we will see early weakness on Monday. HOWEVER THIS PART OF THE FORECAST IS NEAR MEANINGLESS COMPARED TO THE REST SO I WOULD NOT GET TOO HUNG UP ON THAT.
I'm still expecting a $USDX led bounce in the equity market as well as the bond market, certain stocks are going to be shorts before others, but this gives us a chance to open or add to any positions we may want to tweak a little.
As I have tried to make clear, it doesn't look like smart money is even participating in this move, thus my own participation level is so low at present having closed VXX puts today.
In comparison to what comes next, this bounce is nearly meaningless like Monday morning's forecast.
The main theme is strong market weakness and any chance we get to open or add to positions we like should be taken."
I'd call the initial early week weakness about half fulfilled, but had certain correlations held, the move expected , the move that would have allowed short term 3C charts to tighten up and offer a more stable long swing entry before the next trend which is at the bottom of the excerpt.
One of the key parts of the forecast is, "I'm still expecting a $USDX led bounce in the equity market as well as the bond market".
This is based on a correlation that I'd say is nothing short of a carry trade unwind. Remember the days not so long ago in which if you knew where the USD/JPY (Carry trade) was trading, you knew what Index futures had done or would look like as the correlation was that tight? That was carry trade based.
In an unwind situation, things are a bit different, nearly mirror opposite. I'll post this chart now, but it's not the thrust of what I'm getting at, but because the $USD has such a tight correlation with USD/JPY for obvious reasons, it's not far off the narrative.

However once again, the Week Ahead forecast was calling for a $USD-based bond/equity bounce. I should remind you I have been expecting a counter trend bounce in the $USD which would have a similar effect on USD/JPY above.


On April 2nd in a market update I posted my expectations for the $USD as follows...
"The $USD is seeing some weakness which is something I expected near term before a larger bounce and then an even larger decline"

The next expected trend after the bounce according to our 4/2 forecast was an even larger decline which you can see at the series of red arrows with normal counter trend or corrective bounces at the yellow arrows.
This week's $USD led market/bond bounce was to be another counter trend move like the yellow arrows, except I expected a bit of a stronger move.
As of Friday, here's why the correlation , $USD charts, 10 min QQQ (and similar charts) were so key to the "bounce" part of the forecast...
*The $USDX is represented with a purple line, the comparison assets with candlesticks...


Oddly the $USD reacted or overreacted to the downside on the US Retail Sales data, I don't think this was a genuine reaction to Retail Sales, I haven't seen many reactions like that in $USD to retail sales, it's almost as if that was just the "catalyst" or cover for a move lower in the $USD which sent Gold higher.
There are a couple of scenarios that are starting to look probable or worth looking in to.
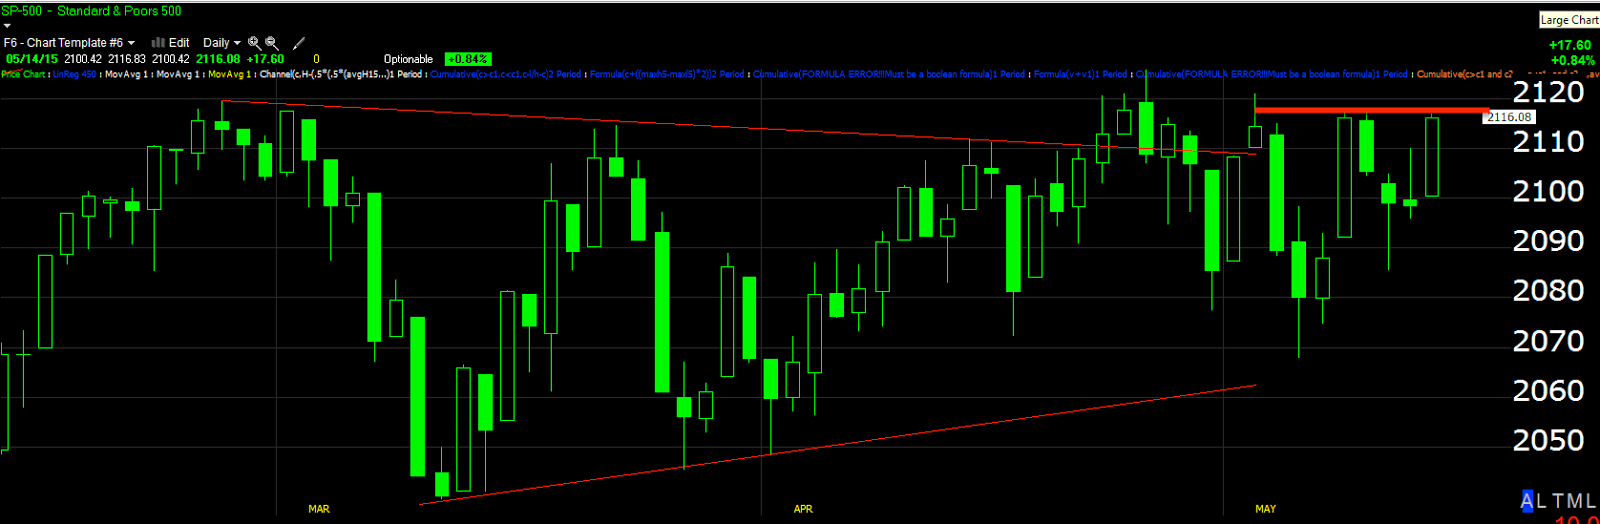
When I see a resistance (or support area) this clear in an asset as watched as the SPX, I immediately suspect a head fake run both hitting stops and limit orders/new orders as Technical traders see a breakout above a clear resistance line.
I have no doubt such a move would fail as the charts below show in terms of very high probabilities...


The second scenario I'd consider is an Options Expiration Max Pain Pin as tomorrow is May monthly options expiration. While it seems less likely, there's some reason for the divergence in equities and the $USD where there's not between bonds and the $USD, it could be the max-pain level is in this area.
I'd normally give the tip to the first scenario, but the one thing that has been missing is the short term charts showing positive divergences which are like timing as they are the equivalent of institutional day traders or short term traders, they'll scalp a move like that, but as we have seen all week, they seem to not be participating which causes me some doubt about the scenario I'd normally call the most likely by far.
As for the $USD counter trend bounce (remember the correlation between the $USD and TLT/Treasuries is still tight....
The $USD counter trend bounce expectation is something that fits with other assets like oil expectations lower, gold expectations near term lower, Treasuries making a counter trend rally, but the $USDX counter trend bounce and those correlations are secondary, the analysis of $USD is why I suspect a counter trend bounce.


They were expected to pullback and repair their shorter term charts just as the $USD has done, they haven't done that and that's WHYB I DON'T TRUST A LONG (MARKET AVERAGES) POSITION. I TRUST THE TLT OR $USDX BOUNCE A LOT MORE, THEY DID THE WORK.

I'm still looking for what the probabilities are and any changes in the market averages, but these are the scenarios and odd market action this week. I'll try to give it to you in something you can trade, but sometimes standing aside is the more profitable stance.


No comments:
Post a Comment