There's something definitely going on in the market, we're use to seeing these set-ups in advance so we know that they plan these out in advance. I admit I'm not sure what the game is with All of the $USD correlations from last week holding up except for 1, the market averages.
Today's short squeeze which I'll point out below required no institutional sponsor ship of the move, the squeeze alone takes care of that which is interesting because that was one of the themes of last week when we were expecting a bounce this week, "
There was no sign of institutional involvement", even on very short term charts like 1, 2, 3 min you almost always see the divergences, I think of them in terms of short term traders, middle men like market makers stocking up or HFT's. There was very little to none of that through this week which is the one thing we were looking for after initial early week weakness. That weakness "should" have provided institutional traders the discount and supply they need to get involved, but I just don't see them there on the charts which is highly unusual.
In any case, to the charts...
You can see a textbook short squeeze example below. Above you can see there's something very wrong with the move in the NYSE TICK which had a decent open at +1500, but after that and especially in to the afternoon where the trend starts declining there's nothing near the kind of TICK readings that should be coming in, virtually trending above 1000 to extremes of +1500-+1750.
Instead, I'd say a fair approximation of the average today is barely better than +250 which would typically be a dead flat market.
This is not only a good example of the price action of a short squeeze which is a near perfect diagonal line with no corrections,
but the additional non-confirmation in the fastest 3C chart of 1 min is telling. Even worse than non-confirmation is distribution signals which are through the entire day, the entire move.
THIS IS EXACTLY WHY I SAID I'D ONLY TRADE A BOUNCE LONG IF THE BASE AND SUPPORTING SIGNALS WERE THERE.
ES 1 min "should see 3C soaring to a new high, instead it hasn't even broken above yesterday's and the deep leading divergence in red to the right is telling, this is about when I put out the IWM trade idea.
When we are in choppy markets like this, it's always good to remember what the highest probabilities look like, the big picture which is below.
This is the intraday NA/NDX futures. We should have seen some accumulation in the yellow area, but there's nothing, again indicative of a short squeeze, but it seems pros didn't want to trade along on the way up, but were more than happy to sell in to higher prices
TF/R2K futures should have seen the same positive divergence earlier in the yellow area, there is none. This 1 min chart is one of the reasons I chose IWM -look at the divergence to the far right.
It's much like the IWM 1 min intraday chart. Again, no sign whatsoever of accumulation , it seems the entire move relied on a short squeeze.
IWM 2 min showing the first half of a divergence from last week which is part of the reason I expected a bounce about mid-week this week, but I also expected some repair work to be done to these short term charts on a decline early this week which you can see in red in the middle of the chart on Friday. Again, there was no positive divergence even on the most sensitive charts at this week's lows.
IWM 3 min is largely the same story. As it stands right now, last week's positive divergence that should have widened out this week looks to either be spent or run over.
This is a closer view of the same 3 min IWM chart above, I'd expect even a small positive divergence at the lows of the week. Instead we have 3C distribution throughout.
Above I said in a choppy market like this it's good to remember what the highest probabilities are, what the trend is when you take away all of the noise, here's the IWM 15 min trend which is quite clear.
As for the Futures beyond the 1 min charts above...
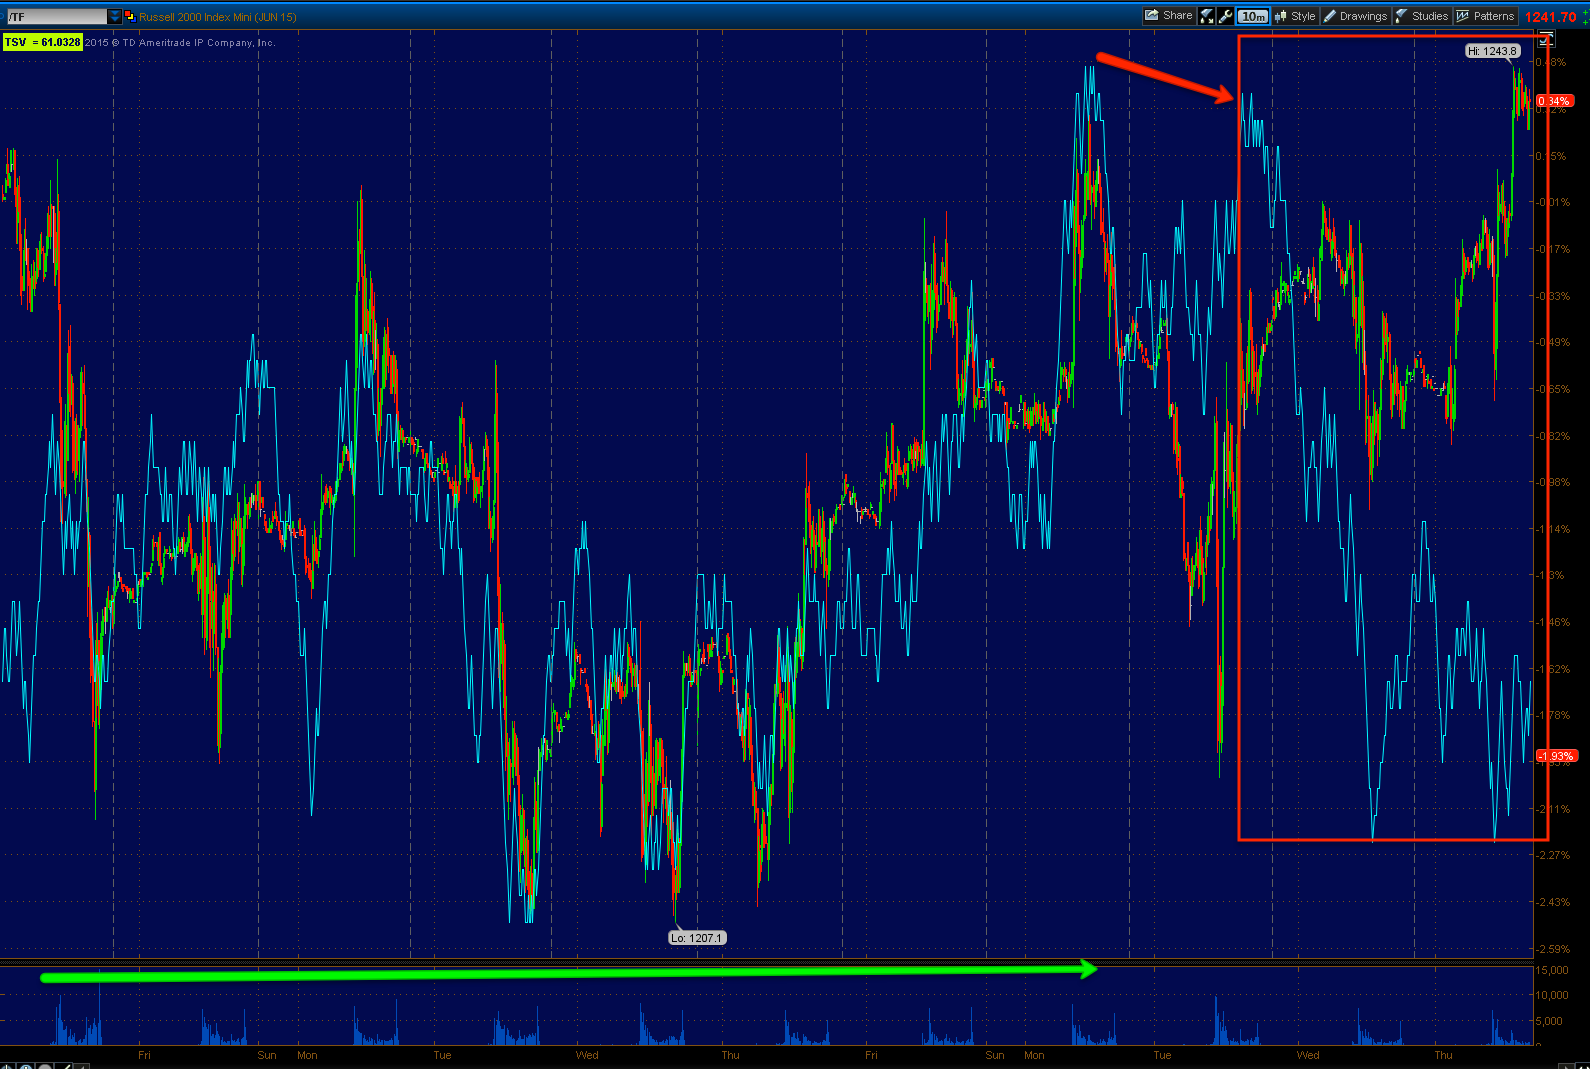
This is the TF/R2K 3 min chart confirming
ES 5 min shows a 3C negative divergence as well, but I chose the IWM because of this...
IWM 5 min chart looks significantly more damaged.
TF 10 min chart shows near perfect confirmation. If we look close I can point out different small divergence, but the point of the chart is going from that kind of confirmation at the green arrow area to the divergence to the far right.
Thus the IWM June Put which gives me a bit of time to get through op-ex tomorrow if need be.


No comments:
Post a Comment