I whenever I'm quiet and not posting too much, that usually means I'm going through a number of assets/indicators, etc. In other words, when I seem least busiest, I'm actually the most busy.
I went through 10 different futures assets in 9 timeframes for each, there are some indications and evidence that is pretty strong, but I'll get to that in a specific post. One of the things that looks very clear is short term $USD strength again, not the counter trend rally kind, but like the 1-day move on 6/5 off the 6/4 lows we had projected, something along those lines.
It looks like near term the Yen is going to give up some of those overnight BOJ/Kuroda based gains, but its bigger picture should continue to build and lift higher, again as near as I can tell, the carry trade *USD/JPY) unwind. While the $USDX looks like very near term strength which should help our USO short/put position, its longer term chart is very negative, again indicative of the carry trade unwind. I'm wondering if perhaps the $USD is discounting a possibly hawkish F_E_D next week and that's what the expected short term strength is about. As for the Euro, it too looks like it will come down off recent gains, I just don't have much faith in it long term doing anything positive like the Yen, in fact I think it will see further downside longer term, but I'll address these in another specific post, I just thought some of you FX traders would be interested.
Crude looks as expected, like it will see more downside.
Now as to the averages, it doesn't look probable that they'll come back down and form a stronger "W" shaped base, the short squeeze sing has been set free and it took nearly 3 weeks to wind so it doesn't make sense to come back down to attempt a stronger base when the strongest aspect of the move, the >SPX 100 day short squeeze has already fired. Thus it means I believe we'll be looking for the actual downside reversal that should carry on the previous 3 week down trend and slice below the 100-day and its way to making a lower low below the October lows, but as I wanted on April 2nd as this forecast was made, we'll likely see short term support last the 200-day below as well, as the forecast expected at the 100-day.
As for charts, damage/distribution continues to accrue, I don't believe we are done with this move timing wise and I already said I believe the 5 min charts will need to see migration of the negative divergence and go south, that should be the cue.
The daily SPX and the upside target we have been expecting as all technical traders must be aware of the SPX's affinity for the 100-day. At the white arrow is yesterday's Doji Star reversal candle, but on a very sharp "V", which I don't ever trust to hold long as it's not a solid foundation. At the red arrow, resistance at the 100-day yesterday making it an easy and obvious target for short stops and long entries. The yellow arrow representing the short squeeze strength lent to the market, remember HYG's short term charts supportive as well, but only short term as well as charts.
Judging by the rate of decline in the 3C charts, I doubt VERY much that this turns down today, we do have options expiration (monthly) coming Friday so that's something to consider as well. I suspect that the candlesticks will put in their own downside reversal with something like a similar Doji or star (in yellow-forgive my poor drawing).
As for the SPY and migration of the negative divergence or "Distribution in to price strength", the 3 min chart is now showing the strongest, clearest path of migration or strengthening of the negative divergence.
The 5 min chart which is mostly in line will need to see the 3 min chart migrate over and turn the 5 min chart negative like the 3 min chart.
As for the IWM, the 3 min chart as well is where we have the strongest migration of the negative divergence and all of this in a single day which is pretty impressive.
The 5 min chart is already showing migration and a negative leading divergence, not quite as strong as the 3 min's divergence yet.
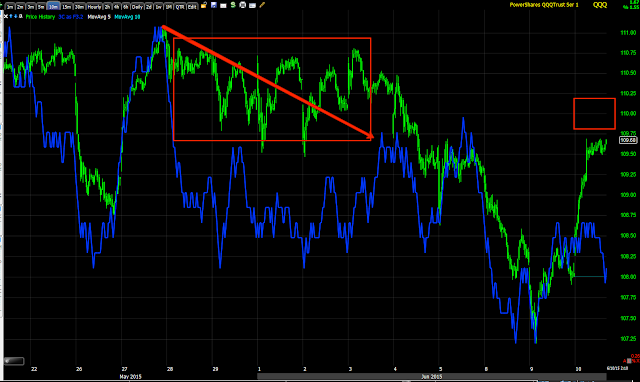
And the 10 min IWM chart refusing to confirm in any way this move, leaving it totally unsupported which is why I believe this turns at the 5 min charts.
QQQ 2 min leading negative...
And QQQ 5 min leading negative are both interesting as is the flat range most of the afternoon where we often see the most or strongest 3C signals, again think VWAP and the stability of filling orders at a stable VWAP.
Again, like the others the QQQ 1o min never came close to confirmation, just the opposite so once again I suspect the 5 min charts are where the action will be and at the rate we are moving, while I don't expect a downside reversal today, if it weren't for options expiration (monthly) this Friday, I'd say we'd be turning before the week ends, but with op-ex Friday, there's no telling since we have had nearly 3 weeks of trending down, I suspect keeping things where they are (roughly) will have the most desirable effect on options expiration.
Is interest rates about to start going up?
-
Yes, I know - it does not make any sense - FED is about to cut
rates...but....real world interest rates are not always what FED wants it
to be.
6 years ago


No comments:
Post a Comment