As you know, I was expecting a head fake move/false breakout above the SPX-100 day moving average, this is where I hoped we'd get enough market support for watch list shorts that have been either flat or not doing enough to make an entry high probability or more importantly low risk which a bounce in them would do.
Yesterday I said a bounce / head fake move off a sharp "V" base would likely not stand very long, perhaps not even a day which is why or part of the reason why I suspected we'd see a slightly stronger "W" base. This is not for the kind of head fake move saw in May love the SPX's nearly 6 month triangle, this is a smaller shakeout related to the SPX 100-day.
Now I HAVE to consider whether this is the move itself and we are not going to see any "W" base for a slightly longer move.

The move above the 100-day is also expected to be a head fake move, in this case it's what we call a "Crazy Ivan", shaking out traders below the 100-day and then above the 100-day as it squeezes shorts and entices new longs in to a bull trap, IT IS FULLY EXPECTED TO FAIL.

The charts right now that suggest to me that it is failing beyond the earlier post, Intraday Capitulation include (as an example, not exhaustive list):


As far as migration or the strengthening of the divergence, we have that too in all of the averages...

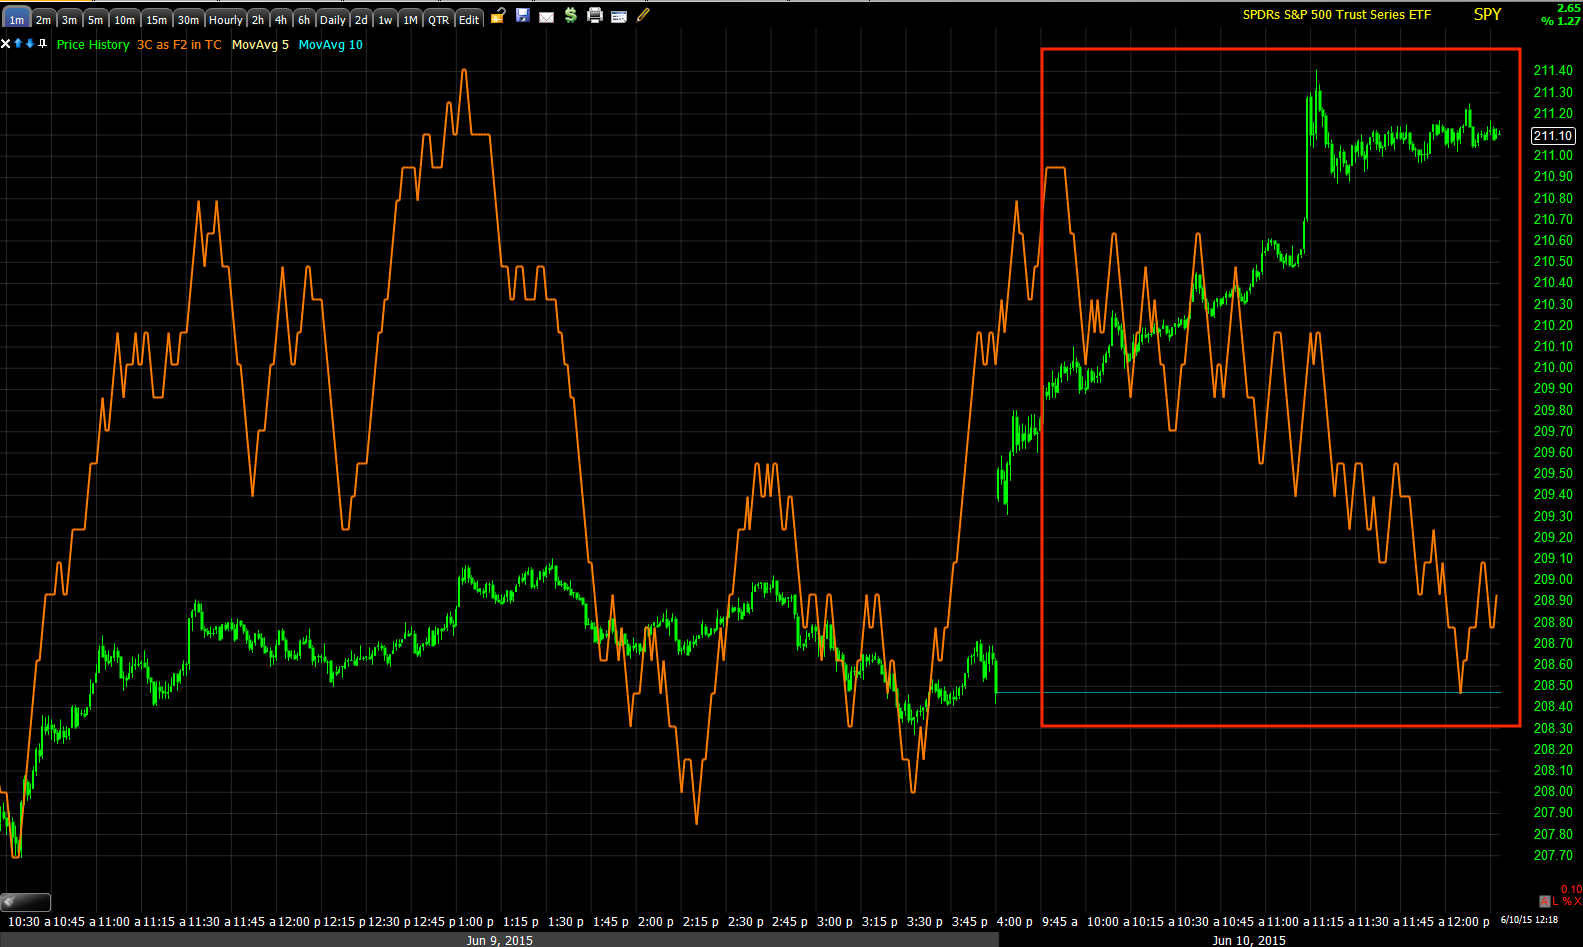
However, the chart that would have to turn for me to start entering positions for the longer trend trade positions we were looking for on such a move above the SPX 100-day would be the 5 min chart's positive divergence that built the last 2 days (below)...

Take a look at the same 5 min SPY chart in context and remember what I said above about the QQQ chart and the $USD counter trend bounce which is now over...

In watching the charts develop and being a bit patient here, the difference would be between short term , quick trades and the longer term, much more profitable trending trades as originally expected to be entered above the SPX's 100-day as it creates a Crazy Ivan shakeout/bull trap.
Furthermore the failure of the market back below the 100-day as was originally forecasted on April 2nd and has played out almost exactly as forecasted (the market triangles develop, there's a breakout above them that fails, the SPX moved down on the head fake move and is temporarily supported at the 100-day and then slices lower and sees the same at the 200-day below, then moves to a new lower low below the October 2014 lows) would be an excellent incentive for the Treasury Flight to Safety trade sending TLT higher. PIMCO didn't exit such a large treasury position overnight in such an illiquid market, that happened over a period of time and that's likely what set up the TLT break below its long term trend line and the current counter trend trade set up we are looking for.
I'll keep you updated.


No comments:
Post a Comment