As I'm going through my watch list (patiently waiting for the charts to develop and mature) and looking for opportunities, I found UNG/Natural Gas looking interesting and I've had a long term interest in the future of NG.
I think you'll agree the charts look quite interesting here. I'll be seeing price alerts on the downside for a pullback, once we get that, it's simply a matter of checking the pullback for accumulation (a constructive pullback), these are the kind I want to buy.
UNG daily chart through 2015 with a flat stage 1 base looking price range and a double bottom to the right.
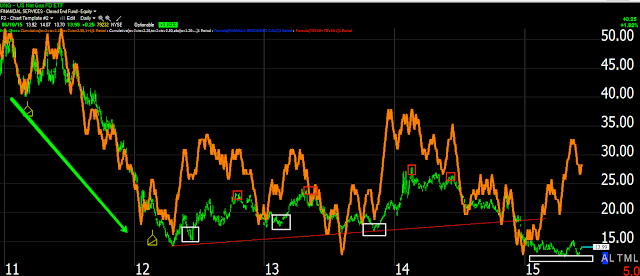
On a 3C daily chart of UNG I've marked the divergence areas , note that through 2015 there has been a large leading divergence for the entire year and this in to a rather flat range.
A closer look at the daily UNG chart with the two bottoms mentioned above to the far right with a leading positive divergence through the entire year.
I checked natural gas futures and on a daily chart they look very similar.
NG daily chart Natural Gas futures with 2015 right of the yellow vertical trend line. Note the leading positive divergence in the same place.
The 60 min UNG chart with more detail in the double bottom area , a strong leading chart.
And the 30 min chart showing the first bottom with a head fake/stop run just before reversing to the upside off a positive divergence/base with 3C in line (no strong distribution at the downside reversal suggesting accumulation is taking place on a larger scale). The second low has an obvious leading divergence on a powerful timeframe.
As for the 30 min chart of NG futures, it has some similar evidence.
NG 30 min futures. There's not as much history which is why I prefer StockFinder over newer Worden software, but you can see the second double base low and leading positive divergence very much like the UNG 30 min chart above this one.
The 10 min chart is not as strong as the charts above, but more detailed because of that and shows the divergence that turned UNG back down to the accumulation zone at the lows of the double bottom area with a very clear leading positive divergence at the area.
The 5 min UNG chart shows the same
UNG is looking pretty amazing here, the issue is a pullback to enter at lower cost with less risk that we can confirm was accumulated before ever entering as I suspect the charts above will guarantee.
There's a very small 2 min slight negative so UNG may be working on a pullback some time soon.
The short term NG futures also show some recent profit taking, also suggesting we may see a pullback soon.
NG 1 min intraday looks like mild profit taking, perhaps in advance of a constructive pullback.
Based on the charts above, I'd be VERY interested in looking at a pullback for a potential long entry. However since we don't have strong pullback divergences/charts, I'll be setting a series of price alerts below from here to about $12/50 and at each alert check the charts looking for accumulation of a pullback for a long entry.
Is interest rates about to start going up?
-
Yes, I know - it does not make any sense - FED is about to cut
rates...but....real world interest rates are not always what FED wants it
to be.
6 years ago


No comments:
Post a Comment