Today's price action and signals have been fairly dull, but the first thought I had as morning trade burned off is still the same thought/expectation I have now and a large part of that is due to VIX short term futures.
There's an incredible capacity for the market to be moved at a moment's notice right now with any Greek headlines or rumors and then of course Wednesday we'll likely see the typical F_O_M_C knee jerk reaction, unless my gut feeling on this is correct and we get our first hike in June.
In any case, from a chart perspective...
SPY 1 min intraday. As early as the pre-market A.M. Update said we'd likely see a bounce off today's gap down, which is not a very unique or talented call, there's a gap, it's likely it gets filled. However I also said that I would not trade this even intraday, the profit vs. risk is just not there as the base/positive divergence area from this morning is really not large enough to give you any kind of an edge, at least not compared to the risk.
The intraday chart still shows what I believe to be the highest probability which is a pullback toward the opening/A.M. lows around the white trendily,
it is there where we'll get the next goof batch of data as to whether a stronger base/divergence is put in in which case I might look at closing VXX calls and/or maybe some short term trades in the averages for a bounce, but I mean very short term as in day trade or a day or so at most.
The ES/SPX 1 min intraday futures has the same signal as SPY 1 min above, also suggesting a pullback toward intraday lows, how the charts react on such a move is the next important piece of data for us with regard to very short term trade.
The 3 min SPY chart is in decent shape for a day, it's still not anything very exciting, but if it were to add to its base near intraday lows, as I said, I'd probably close VXX calls for a short time and maybe consider some other short term TRADES.
However put the same 3 min chart in context and you see this is really nothing special...
Several bounces have all ended badly in the same timeframe of SPY.
The VXX 2 min chart is showing intraday confirmation which I'm a little surprised at, I thought it may stay weak on the 1-2 min charts today.
It's this leading 5 min chart that tells me whatever happens with the market averages, it's either not good or very short lived as VXX trades opposite the market and has a strong 5 min leading positive chart.
Beyond that the VXX 10-15 min charts look excellent, which would have the opposite meaning for the market averages as they trade opposite VIX/VXX.
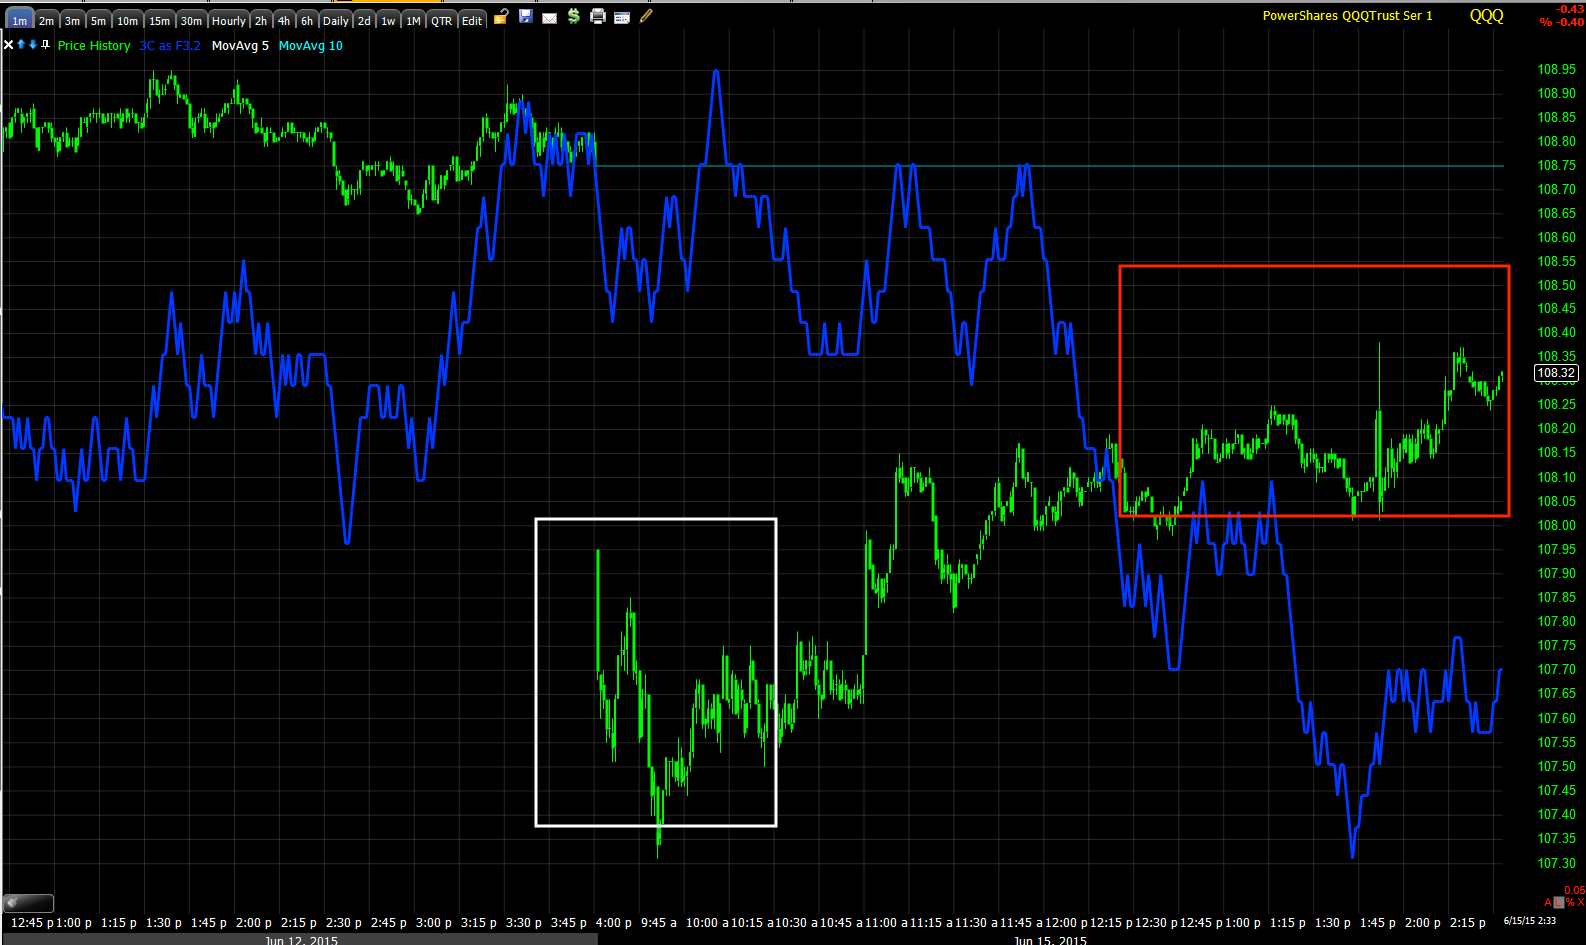
The QQQ 1 min chart looks like the SPY and ES 1 min chart and also looks like a near term pullback toward today's intraday lows, there we can see if there's any accumulation intraday or whether it's just ugly.
Like SPY 3 min, QQQ 3 min also looks good intraday, but again this is only a 3 min intraday chart and if it were a base, it's less than a day, a "V" shaped base and you saw what happened to the last attempted bounce off a "V" shaped base last week as it failed and made lower lows.
This is why a pullback to the intraday lows would give us a lot of information and a very good idea of what to expect very short term. I think the VXX 10-15 min charts give us a very good idea of what to expect beyond this very short term trade and it's not good for the market.
The QQQ in the same timeframe as the VXX 10 min leading positive is in a 10 min leading negative divergence which is additional confirmation of how any very short term move,
if the market can get it together, ends...
The intraday IWM like SPY 1 min, ES 1 min and QQQ 1 min also suggests a near term pullback to this morning's intraday lows.
As does Russell 2000 intraday (1 min) fruits like ES. The yellow trendily is where I'd like to see price just to get a feel for how underlying short term trade is reacting.
Again, like the 5 and 10 min chart (negative in the averages/positive in VXX), the IWM 5 min is leading negative so it doesn't have a very strong looking future even on a very short term basis, but until we get a pullback toward the intraday lows, it will be difficult to add much more detail unless we get some new/additional signals, but thus far this seems to be it.
The TICK chart has been a bit more volatile than I would have expected based on price action alone...
There are several +1500 moves in TICK which is surprising given the flat range through most of the afternoon. On the downside, while not as strong, there have been several >-1000 tags, which is also a bit surprising.
This market is a bit more volatile than it looks.
Again, this all tells me that the highest probability path right now is patience, I sure wouldn't have wanted to chase price and be stuck flat all day in the market on such a sharp "V" pivot. That's a lot of risk for what we already know statistically is very little reward.


No comments:
Post a Comment