In days past, the kind of gaps down we are seeing in the averages were very valuable tools for gauging the market. I would have said that they were nasty gaps that will hold, but since the rise of an HF dominated market, gaps are less and less common, constantly being filled, not to say that there's much more to the market than that, a short term gap fill doesn't change the bigger picture.
Right now the SPX is right at the area I expected it to meet with some support, but the previous 3-days' candlestick pattern, also was a confirmed reversal to the downside.
Daily SPX chart with a 100-day (yellow) and 150-day (pink) moving average. In the yellow box is the head fake move above the triangle's range which we called out in the April 2nd forecast as a move coming and a move that would fail, but the market would not see any meaningful downside until that move made its appearance and failed which it did.
The 100-day (yellow) was expected to act as short term support as the market put in a normal correction which it did. The last 3-days of candlesticks formed a bearish downside reversal with the confirmation candle on Friday, the last 2-days were each drawn a day in advance (best guess as to what they'd look like) and we were right on.
Today's price action thus far has broken the 100-day as expected and found some intraday support at the 150-day, where it found support on the last decline, this is also not unexpected.
Whether this holds and leaves the gaps above open or not is the short term question, the bigger picture (taking the F_O_M_C out of the analysis for now as that's a wildcard), is not very bright for the market as it has done everything expected since the April 2nd forecast which includes a move below the October low eventually as we continue to move lower, find some temporary support, correct and move lower again.
So far intraday since ES has the most continual 3C chart history for the new week, it is still showing the market as being in line with the downside.
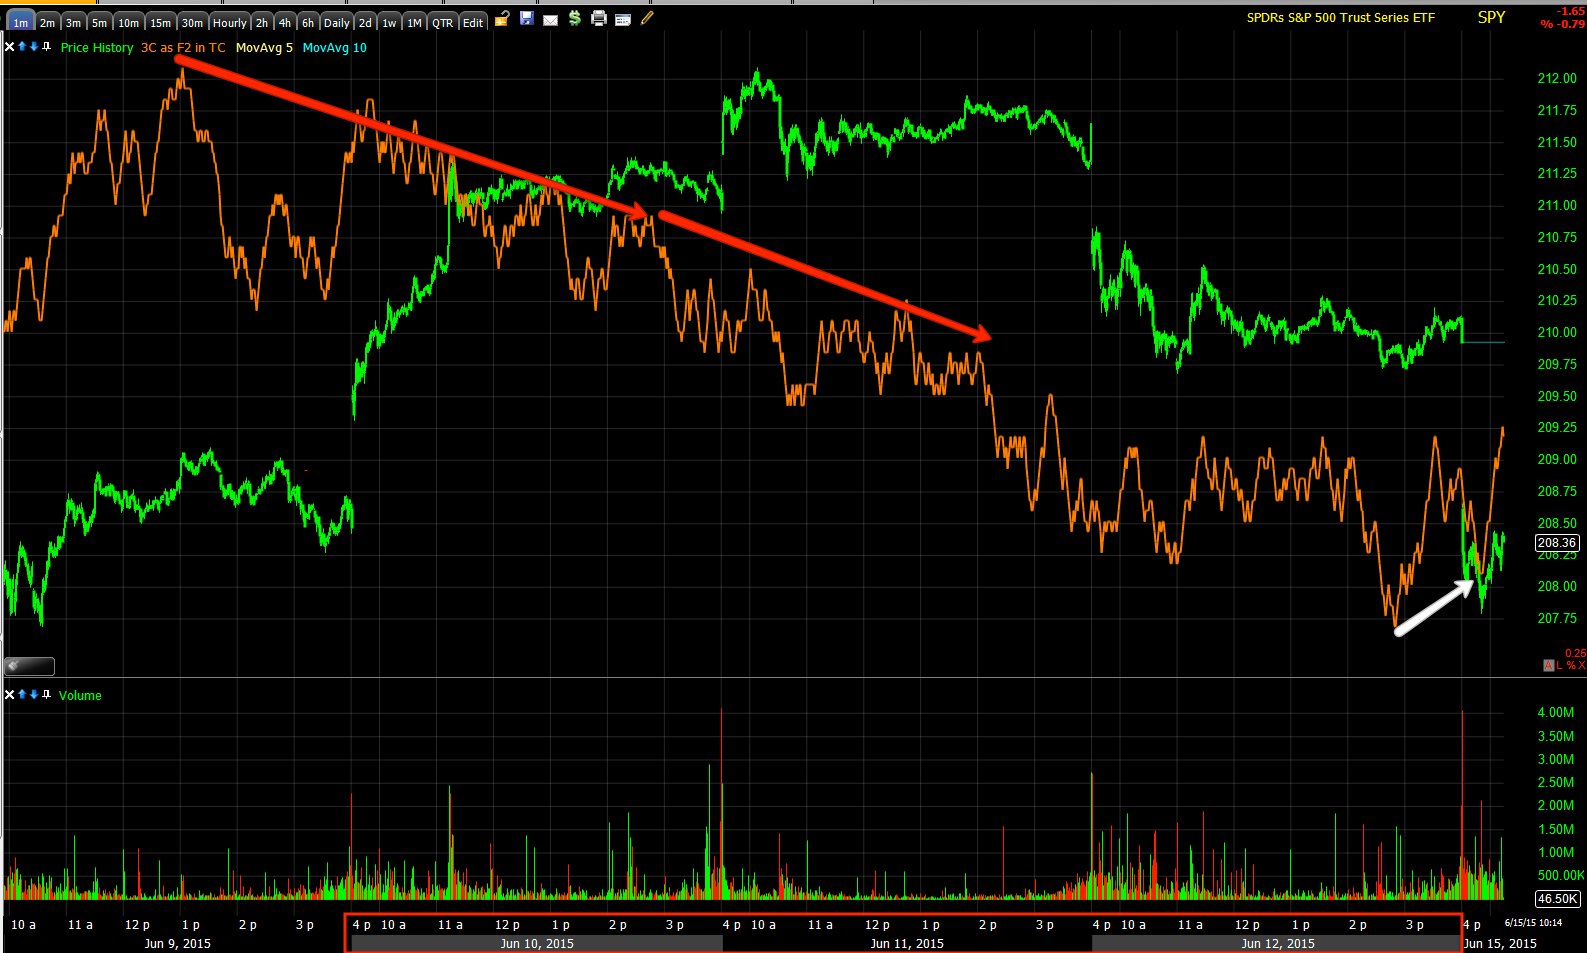
There are some hints of intraday support at the 150-day moving average which was to be expected...
SPY 1 min leading negative at the 3-day candlestick reversal price pattern with a very small intraday positive to the far right, likely indicative of some intraday support at the 150-day m.a.
The IWM and QQQ's are showing something similar on the 1 min chart as well.
This is not , at least at this point, anything I'd want to trade (Day trade) as an intraday bounce, it's too early, there's too much that can still happen today and the charts are just setting up for the week with ES in line with the downside this morning.
This is the bigger/head fake picture with the accumulation we saw market wide from May 5th to May 7th and the distribution on a rounding top sending it lower to the 100-day with a small positive there leading to last week's bounce which gave a negative/reversal signal as well as this 10 min chart is leading negative plus the candlestick reversal as well.
This is a more important chart for me right now than the very short term intraday charts, it is strong, it has tracked the entire cycle seen above and it is leading negative. Thus short term/intraday I'll stay patient for a bit and let the positions that are in place remain in place until/unless I see some reason to change them.
VXX 1 min intraday is not confirming its gap up which is not surprising given the SPY, QQQ, IWM 1 min charts, but again I will stay patient and keep the July 17th VXX call in place for now, which is up around +22%.
VXX's bigger picture 5 min chart went strongly leading positive last week, the 10 and 15 min charts were already in good shape, but even the shorter term intraday version of these intermediate charts improved as well...
VXX 10 min. leading positive which made last week's break of support in VXX look like a head fake stop run, thus I'll be patient with the position and not overreact on some intraday support that market is finding as was expected.
HYG doesn't look like it will be used for any serious market support, it looks like it will continue to a lower low which is part of the trouble this market is facing,
What High Yield credit is Screaming
For now, I think patience is the key word, let the market settle in and keep your eye on the target/big picture until/unless something in the short term charts requires us to take action. Otherwise, I'll continue looking for additional opportunities.
Last Friday's,
Trade Idea: XLF Trend (short) is working out well, already nicely green. These are the kinds of set-ups that I'm looking for, timely and in excellent position.


No comments:
Post a Comment