First of all, Monday when we saw the slice right through the 150-day moving average as we forecast in Friday's The Week Ahead post:
"I see nothing that would interfere with continues downside and breaking support until the next support level and we'll likely know before we get there whether it holds as short term like the 150-day or we slice right through."
Which was spectacular and definitive, looking like this...
The daily SPX chart showing the April 2nd forecast of a head fake/failed breakout leading to stage 4 decline with first support around the 100-day causing a short term bounce and slicing through moving toward the October lows eventually... This has perhaps been our best advance forecast for that major market averages.
However as you know, we took a lot of gains off the table as it looked like a 1-day oversold event, Closing QQQ July 17th $110 Puts For Now at an +83% gain, Closing VXX July $17th $18 Calls for the Same Reason as QQQ for a 31% gain, Closing Out USO July 17, $20 Put for a +26% gain and Closing TLT July 17th $117 Calls - Looking to Re-open at better price for a +46% gain.
All of these positions were closed to protect gains and to re-open them at better prices with longer expiration dates as almost all expired 7.15 which is getting too close for comfort.
However this also created a 1-day oversold event and likely bounce scenario, Market Update-Near Term Support/Bounce Probability Growing.
Everything I said we'd be looking for in Monday's Daily Wrap, showed up perfectly as expected Tuesday.
COUNTER TREND MOVES ARE NOT JUST TO RELIEVE AN OVERSOLD CONDIITON... They are psychological warfare and meant to cause traders to question their positioning and create movement.
Instead of emails today asking why I didn't close yesterday's IWM calls entered at the end of the day on the open this morning for a decent gain, which some of you did in different assets you chose late yesterday, in some cases making 6 weeks of normal people's (People I know) paychecks in a trade that was opened near the close yesterday and closed at the open today, which I can't argue with... THESE MOVES ARE MEANT TO BE PSYCHOLOGICAL WARFARE CAUSING MOVEMENT AND MOST EMAILS I'D EXPECT TO RECEIVE WOULD BE ALONG THE LINES OF...
"This move looks very strong, are you sure we should be entering new short/put positions?"
That's what these kinds of moves are designed to do. So based on my knowledge of the market, my knowledge of Wall Street's psychological persuasion, and the extremes of counter trend moves, today's open just didn't seem to be the move I was looking for and I don't want to enter new put positions prematurely at less than optimal conditions if there's some objective evidence that something doesn't look right.
Without getting in to all of the charts, here's an example of what didn't look right...
5 min VIX Futures chart showing a negative divergence. When VIX Futures are ready to break to a new high with the market breaking to a new low, they should be showing unmistakable accumulation, not this leading negative divergence suggesting they have more downside to goo, implying the market has more near term upside to go.
The 15 min VIX futures shows the kind of positive divergence that results in big moves like this week's as seen in white. However the leading negative divergence is not what I'd expect to see for a market that has spent all of its upside fuel and a VIX chart that has run out of downside momentum.
As for the IWM call position opened late yesterday on clear leading positive TF 10 min chart positive divergences, although there's some damage today, it's still leading and doesn't fit at all with the VXX charts above.
There are a lot of other charts from currencies to other timeframes, other assets that also don't fit, but these two stuck out the most and should give you some idea of why I have been suspicious of today's price action, which seems to be putting in some changes of character recently.
SPY intraday building 1 min positive divergence.
SPY improving 3 min positive divergence (intraday).
IWM 2 min improving positive divergence.
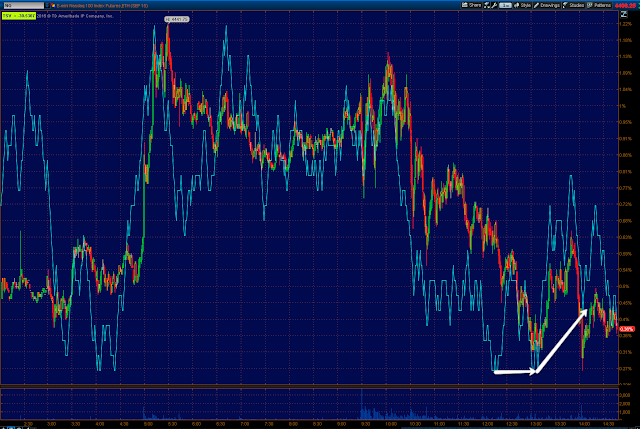
NQ 1 min NASDAQ Futures improving chart.
VXX intraday deteriorating 1 min chart.
UVXY intraday deteriorating chart.
Sometimes patience is very difficult, but as long as there's objective evidence, that should over-rule emotional reactions to price action alone as nothing is so deceiving as price action.
Is interest rates about to start going up?
-
Yes, I know - it does not make any sense - FED is about to cut
rates...but....real world interest rates are not always what FED wants it
to be.
6 years ago


No comments:
Post a Comment