Thursday, July 14, 2011

SPY Chop

Remember I sad I thought the SPY/Market would need to chop around sideways for a bit before it can move higher. This gives institutional money the time they need to accumulate a position to move the market higher. I'm not expecting much for tomorrow, but $132-ish-$132.50 feels right to me based on the options chain as tomorrow is op-ex. I need to look at the chain again and see if anything has changed that would change the most probable target. In the meantime, here's the SPY chopping.
 Here's the sideway chop I mentioned earlier...

And here's a positive 1 min divergence as the SPY chops, note that the divergences are sharpest near the lows of the range.

As I write this, the SPY is breaking lower, I'll have to sniff around, t may just be a head fake to accumulate more now that a range is established, you'll note volume picked up on the break below the range. The chop is helping VXX

RIMM Update

So I have better visibility on RIMM, I am not seeing broad time frame confirmation, but there are some positives, this leads me to believe RIMM may turn into a volatile Crazy Ivan shakeout, both below support as we saw briefly today and above resistance and into the gap. I don't as of now, see this as a major trend reversal, but more like a Wall Street play thing. Lets face it, RIMM is getting their butts handed to them by AAPL and a few others, but RIMM has been significantly discounted and the bargain basement crew is probably sniffing around.

 The daily chart, RIMM's break of resistance was ever so slight, BUT t was exactly what it needed to be because technical traders always seem to look at support and resistance and define it down to the penny, making it that much easier for Wall Street to game them. Even if they didn't load their brokers with stop loss and limit orders, the support zone was so well defined, it didn't take much to figure out where they needed to take RIMM to enjoy a nice fishing expedition for stops in rich waters.

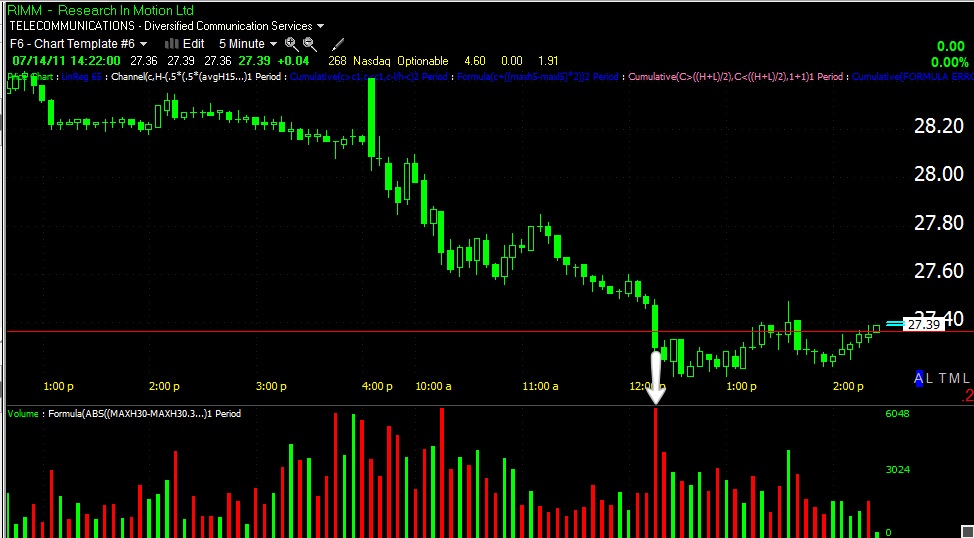
 And here it is... Look at the volume on the break of the support line-note I didn't say zone, because volume swelled exactly where support was on the break (white arrow)

 Here's the intraday action, the early sell-off on the open, and this was predictable just by the price pattern that we would see a negative divergence right there. As for the shakeout, look at 3C-guess who was buying the shares that were sold most likely on stop-loss orders?

 The 5 min 3C confirms the 30 min chart above.

 As does the beautiful relative divergence at the break (in white)

Because there's not broad confirmation (at least yet), I would be looking for a Crazy Ivan shakeout. The downside may be hit one more time for good measure and if you wanted to run a quick long play, the deeper the break, the better. We can either confirm with 3C, or you can just wait for price to cross back above support, then the shorts will be in the squeeze which will help propel RIMM higher-this is contingent on a nice healthy downside break and a positive divergence on it. The white arrow is our signal candle and a move above that, especially on a close in which the low of the day is higher then the signal candle's high, would be a good indication of a move into the gap, maybe even slightly above the gap. If this happens, we'll want to watch for distribution and an opportunity to sell RIMM short; the trade would have excellent probabilities and a good risk:reward profile. That's my take on RIMM from what I see right now.

VXX Update

Glad you used a trailing stop? Now that we have eyes on the underlying action, things make sense and weren't too far off from my earlier blind analysis. This just goes to show you how useful RS can be as a divergence indicator and how predictable Wall Street is, whch is only predictable because of the predictability of retail technical traders who stick t rigid dogma and don't adjust to the market.

 Here's our earlier "bullish" technical pattern which has been described as a bullish pattern for nearly a century-that's a lot of built in bias for technical traders. Note RSI did a good job of calling out the negative divergence and look at that volume-REBATES!!!

 When we look with 3C, we see the initial shakeout didn't provoke much and really looked more like a standard pullback after a breakout. The new highs is where the distribution came in to play. We are now in a leading negative divergence at the 50 sma on a 5 min chart, which happens to be the same moving average and timeframe intraday or day traders often use.

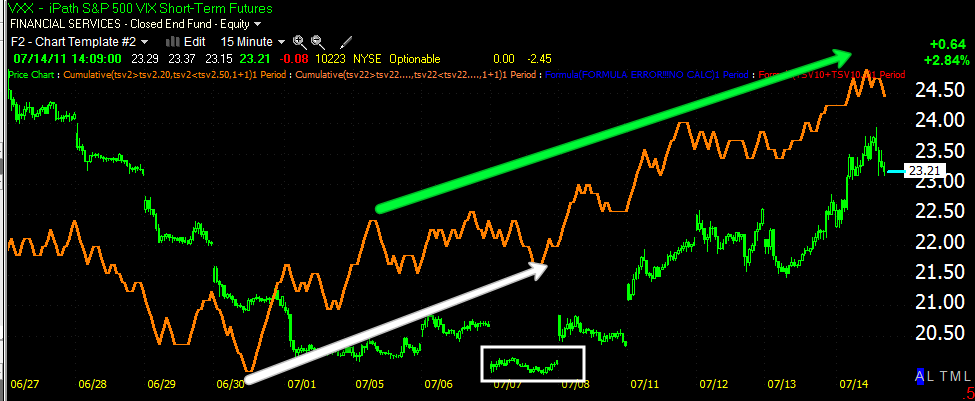
However, although today's trade which may be a carry over from yesterday for some of you and could have yielded up to a 10% gain in about a day, may be coming to an end, there will likely be more opportunities in VXX. This 15 min chart shows a substantial base accumulated and confirmation of the uptrend. After a pullback, we'll be looking for the next entry. If you are an options player, you should do pretty well with VXX in a short period of time.

FAS Request

And just to show how far we are behind the information curve (and being far behind can mean 1 hour), the source of our current pop in the market comes courtesy of a rumor that a debt ceiling deal has been reach to cut $1.5 trillion (as it's a rumor, I add Doctor Evil's snarky laugh for emphasis after the $1.5 trillion) in deficit cuts. Funny how the short term 3C went positive just before the rumor popped.... (sarcasm added for emphasis as we all know the game).

In any case, a rising tide lifts all boats, right? So lets take a look at FAS of Financials. Remember yesterday I showed you sector rotation showing Financials likely to outperform the S&P and thus far they are, by a small margin.

 Here's XLF 1 min 3C note the positive divergence into the day's lows and a current leading positive.

 Here again we see it on the 5 min chart

 And the 10 min chart posts a spectacular relative and leading positive divergence into new lows.

 The 15 min chart does the same with the strongest divergence coming in right before the rumor was put out for public consumption (so far a non-verified rumor as well).

 And even here on a 30 min chart, the divergence s strongest at the day's lows and new lows on the chart! That's 5 time frames all confirming!


As you can see the more important longer 60 min timeframe isn't budging so bounce? Probably. New uptrend? Doubtful, but financials do appear to be moving in to rotation which means they should outperform the S&P on a relative basis (don't forget, that can mean they fall less then the S&P in a decline).

As for playing FAS long,  would consider it to be, in the words of one Ben "helicopter" Bernanke, "transient"

Keep an eye on the SPY

 Today's trade can be characterized by the 50 sma on a 1 min chart, the last market update suggested we'd see some upside and it looks like we are getting a bit now, although a lateral range is still something I think is probable as I explained, it would be choppy. There was a slight wedging of the SPY downtrend, see the capitulation in red and the volume picking up on the move up.


GLD Update

 GLD daly Indecision candle-this opens the door to a reversal as momentum has been fading the last 2 days.

 Here's the 15 min 3C chart, showing accumulation, especially on the 7/1 dip, but the red arrows have been showing distribution and this is why I've been warning that I don't trust this move in GLD.

 The 10 min chart has really gone downhill today, it's been negative, but today it went leading negative (in the red box) which s the worst kind of divergence and this at new highs, it looks like this is under heavy distribution.

 The more detailed 5 min chart shows a positive divergence at the close yesterday, suggesting the gap up we saw this morning, remember though these short term charts are just tactical movements and have little to do with the big picture until they are part of a multi timeframe confirmation.  Note the 5 min is leading negative as of today on the attempt to test today's highs.

The 1 min chart (even more detailed) also confirms yesterday afternoon's positive divergence suggesting a gap up this morning (in the white box and arrow). Note the highs were under distribution around 10:15/10:30 as previous harts showed. We have another leading negative divergence on the 11 a.m. move to test the highs of the day, not a good sign for gold.

Market Update

Lets start here..

 DIA 15 min has a relative positive divergence and note we are near the bottom of the range, this suggests to me that the market will move higher, either later today or tomorrow and likely be in the range of the Op-Ex pin we've been looking at. This isn't a strong signal as the 30-60 min charts are still very ugly.


 DIA 1 min, here's the negative divergence right off the open around 10:15-10:30, since then the 1 min has been in confirmation with the price trend (green arrow).

The IWM looks to be one of the weakest, and is only showing a 1 min positive divergence. I suspect there will be a lateral trading range and a few more 1 min positives put n before it can move north.

 QQQ 5 min-this is another weak one, with a positive divergence only as long as the 5 min hart, but still enough to suggest some upside in to Op-ex Friday.

 The Q's 1 min confirm this finding.

 SPY 15 min positive divergences, this is one of the stronger ones at a 15 min positive.

The 5 min is also showing a relative positive divergence, again I suspect probably some choppiness into a lateral zone before it could move higher.

Remember, I'm not expecting much more then $132.50 for a close on Friday n order to pin the Calls and Puts.

Got my Eyes Back-Wll be updating like Crazy...

VXX Update

And this is why I'd be trailing that intraday stop...
The consolidation is bullish and way too obvious, the black box systems were likely to game it. Note the RSI divergence on the breakout. Now whether they pull a Crazy Ivan and shake the tree both ways or they just go for a directional move, it's difficult to say without eyes on the underlying action, thus the trailing stop.

This is a small example of a bullish continuation pattern called an ascending triangle. Technical traders are going to buy the breakout, n fact they are usually going to buy the pattern even before the breakout because it has a bullish bias. WALL STREET KNOWS THIS IS HOW TECHNICAL TRADERS WLL RESPOND, thus the black box systems which are insanely sophisticated, are gong to game the pattern.

Like most of you know, my cousin is the tech guy on a private investors own little black box system. They're only an independent trading firm trading this guy's capital, not a hedge fund or anything like that, but have spent millions installing network hubs to reduce their latency by milliseconds if not micro seconds. You can get free pattern recognition software out there so you can imagine what the HFTs on Wall Street are running and it's mostly about volume and taking advantage of the predictability of technical traders, they resort to this because for most firms, it's just too expensive to get low enough latency to front run and too many firms are specializing in it, so the pattern recognition plays have been big on Wall Street lately.

Anyway, keep an eye on VXX, it can certainly move up more from here, but the game must be played.

RIMM

I'm still blind in one eye, but I got an email about RIMM, so lets take a look.

 The first thing that stands out on this chart is RIMM's total lack of relative strength vs the market, it didn't rally at all with the market during the short squeeze. The white arrow is the signal candle, a close with a high lower then the signal candle's low will put this into a swing downtrend classification. All of the candles in the yellow box are noise, not one contributed to a higher high and not one had a high lower then the signal candle's low. Often these lateral formations are used for accumulation or distribution, as to which this one is, I need to see intraday charts and confirmation.

This is a 5 min chart and an opening like this is rarely good news. You can see support is being broken right now and it's triggered some stop-losses and probably some short sales as volume has increased. However, don't be surprised to see some gaming of the resistance level, even with the most bearish stock, Wall Street s still going to play the game and that has a lot to do with volume rebates so the more volume they can create, the more money they can make; it's just a fact that we see all too often.

Here's the daily 3C chart as of yesterday.
There's a very clear cycle with accumulation in July/Aug 2010 and distribution Jan-Feb 2011-a complete cycle from stage 1 accumulation, stage 2 mark up (which 3C confirms making higher highs with price), Stage 3 distribution at the red arrow and stage 4 decline. Right now on the daily there's a positive divergence, so until I can get eyes on the intraday charts for confirmation, I'd be a little careful. If that is real accumulation, then a break below support today would make sense.  The recent positive divergence isn't huge like the 2010 one so if it is confirmed, it would probably show a decent rally (if it is confirmed), but  don't think it will change the downtrend, it may technically speaking, but bigger picture, I'd view it as a bear market rally.

In any case, as soon as 3C is back up, I'll confirm whether or not that real accumulation.