So I have better visibility on RIMM, I am not seeing broad time frame confirmation, but there are some positives, this leads me to believe RIMM may turn into a volatile Crazy Ivan shakeout, both below support as we saw briefly today and above resistance and into the gap. I don't as of now, see this as a major trend reversal, but more like a Wall Street play thing. Lets face it, RIMM is getting their butts handed to them by AAPL and a few others, but RIMM has been significantly discounted and the bargain basement crew is probably sniffing around.

The daily chart, RIMM's break of resistance was ever so slight, BUT t was exactly what it needed to be because technical traders always seem to look at support and resistance and define it down to the penny, making it that much easier for Wall Street to game them. Even if they didn't load their brokers with stop loss and limit orders, the support zone was so well defined, it didn't take much to figure out where they needed to take RIMM to enjoy a nice fishing expedition for stops in rich waters.
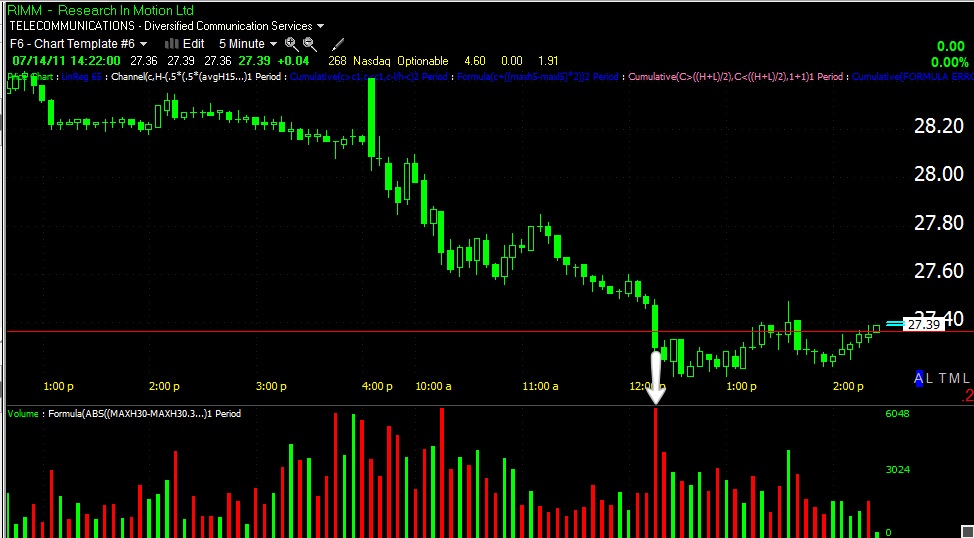
And here it is... Look at the volume on the break of the support line-note I didn't say zone, because volume swelled exactly where support was on the break (white arrow)
Here's the intraday action, the early sell-off on the open, and this was predictable just by the price pattern that we would see a negative divergence right there. As for the shakeout, look at 3C-guess who was buying the shares that were sold most likely on stop-loss orders?
The 5 min 3C confirms the 30 min chart above.
As does the beautiful relative divergence at the break (in white)

Because there's not broad confirmation (at least yet), I would be looking for a Crazy Ivan shakeout. The downside may be hit one more time for good measure and if you wanted to run a quick long play, the deeper the break, the better. We can either confirm with 3C, or you can just wait for price to cross back above support, then the shorts will be in the squeeze which will help propel RIMM higher-this is contingent on a nice healthy downside break and a positive divergence on it. The white arrow is our signal candle and a move above that, especially on a close in which the low of the day is higher then the signal candle's high, would be a good indication of a move into the gap, maybe even slightly above the gap. If this happens, we'll want to watch for distribution and an opportunity to sell RIMM short; the trade would have excellent probabilities and a good risk:reward profile. That's my take on RIMM from what I see right now.


 | Theme by Thur
No comments:
Post a Comment