Glad you used a trailing stop? Now that we have eyes on the underlying action, things make sense and weren't too far off from my earlier blind analysis. This just goes to show you how useful RS can be as a divergence indicator and how predictable Wall Street is, whch is only predictable because of the predictability of retail technical traders who stick t rigid dogma and don't adjust to the market.
Here's our earlier "bullish" technical pattern which has been described as a bullish pattern for nearly a century-that's a lot of built in bias for technical traders. Note RSI did a good job of calling out the negative divergence and look at that volume-REBATES!!!
When we look with 3C, we see the initial shakeout didn't provoke much and really looked more like a standard pullback after a breakout. The new highs is where the distribution came in to play. We are now in a leading negative divergence at the 50 sma on a 5 min chart, which happens to be the same moving average and timeframe intraday or day traders often use.
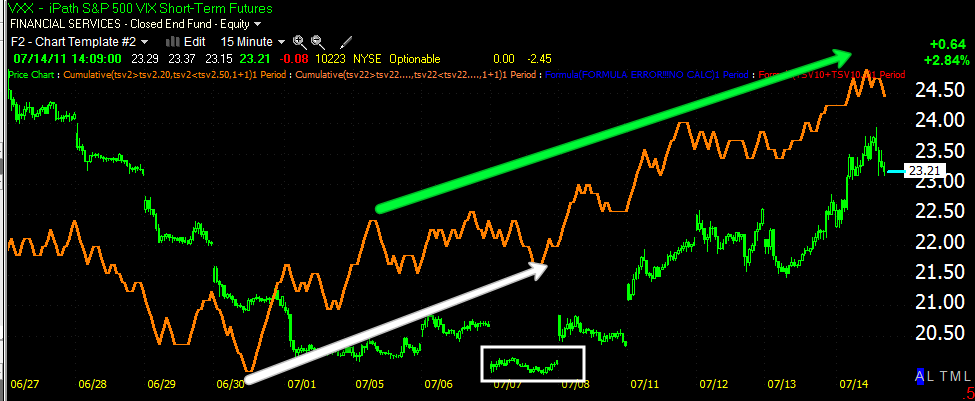
However, although today's trade which may be a carry over from yesterday for some of you and could have yielded up to a 10% gain in about a day, may be coming to an end, there will likely be more opportunities in VXX. This 15 min chart shows a substantial base accumulated and confirmation of the uptrend. After a pullback, we'll be looking for the next entry. If you are an options player, you should do pretty well with VXX in a short period of time.


 | Theme by Thur
No comments:
Post a Comment