Monday, December 3, 2012

After Hours Trade

So far the S&P  and NASDAQ 100 e-mini futures are doing what we thought we'd see early this week, they are bleeding lower. From  opening trade this morning (even from last night) to the present, NQ has gone from the highs at 9:30 (including all overnight trade since Future opened yesterday) to the lows of the new week just 8 minutes ago, an travelled 31.75 NQ points lower since 9:30 this morning!

ES put in a high at 7:51 a.m. this morning, which is 8 ES points higher than ES's close on Friday, the lows for the new week in ES were hit at 4:42 and we have moved an incredible, .25 shy of 20 full ES points, almost 10 points below Friday's 4 p.m. New York close and we still haven't dealt with the triangle in the EUR/USD yet!

Sometimes we stand so close to the trees we can't see the forest.

AAPL Update is Coming!

AAPL Puts and FAZ Calls Still Open

I have ZERO reason to close them, I'm going to put up a nice AAPL update next, there's lot of good information and concepts there so even if you don't have a position, you may want to check this one out.

I'll try to get to FAZ as well as a wrap for the day.

And there goes the ES/NQ 1 mins.

Ran over, NQ is still technically in a positive position, ES is destroyed and if you want to see what is doing it, it's what I've been talking about the last few hours...
It's the start of a break BELOW the apex of the "bullish" triangle. However because the tringle's apex is so close to being finished, the distance to move the Euro up and shake out stops above the triangle is pretty easy here so I wouldn't commit myself to the first move being the final-we could have  modified Crazy Ivan shakeout. What I feel comfortable with is however the tactics go, at the end this is lower with the market.

The only short term hints have been in the Euro/Dollar futures themselves...

Euro intraday has remained almost exactly in line, but...

The Dollar Index (beside having positive longer term divergences), the 1 min here is very strong/leading positive.

It's still about the Euro for now.

Averages Update-Nothing on the upside to get excited about

You can basically read the last paragraph and get the gist if you like.

The QQQ 1 min is VERY hard to call a positive divergence because it's leading negative so bad, but we are looking at the larger picture from the 1 min chart showing a leading negative divergence from late Friday through all of today, this is not good .

If we look at the 1 min chart on a zoomed intraday basis then we see the distribution right on the open and a small relative positive divergence, this is really so small it's almost totally insignificant, but with the set up in the EUR/USD, even the smallest details aren't insignificant right now.

The 2 and 3 min charts are for the most part in line intraday. The 5 min above is horrendous, but intraday that little white arrow does count as an intraday positive divergence, it is so small compared to the leading negative, you can assign probabilities according to their size.

The SPY intraday timeframes and intermediate are all leading negative badly, on an intraday basis there could be an argument made for a relative positive divergence, but if the EUR/USD didn't look the way it does, I wouldn't even give it a second thought.

The DIA 1 min was mostly in line earlier, it ha deteriorated.The 2 min DIA you could make a case for a small intraday positive divergence, the 5 min leading negative is so huge compared to it though it wipes it away. That's to say nothing of the 10-15 min charts that are leading negative.

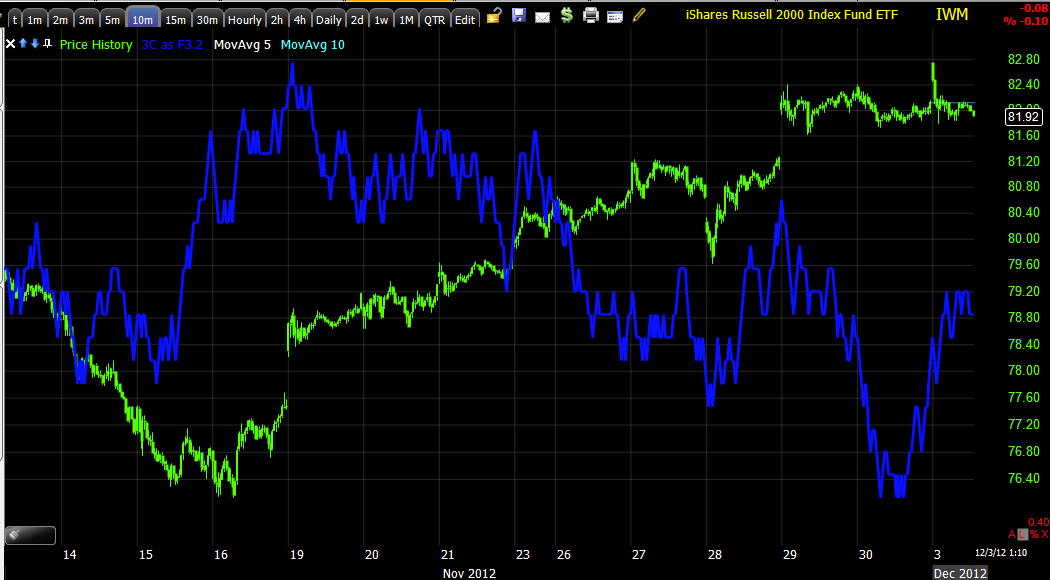
THE IWM 1 MIN IS IN CONFIRMATION, YOU CAN KNIT-PICK AND CALL THE 2 MIN A SMALL INTRADAY POSITIVE, BUT THE (sorry for the caps) 5, 10 and even 30 min just blow it way with leading negative divergences.

The entire point here is if we even give these small intraday positives the benefit of the doubt and cal them positives, they would be exactly in line with a head fake break out in the EUR/USD that failed and too everything lower.


Market Update

I have to check the averages, but both ES and NQ have 1 min intraday positive here.

EUR/USD Technicals

The EUR/USD is actually at a very explosive area right now, being this has so much bearing on the market, I thought I'd show you. I feel confident of where it will end up, but in the VERY near term (like this afternoon) we could see a couple of different scenarios play out because of the technical pattern.

 Here's the real pattern that will be explosive near term, a bullish ascending triangle which should follow an uptrend, this one does. The Technical implication is an upside breakout, the real world implication is usually  failed upside breakout followed by a downside reversal as trader are easy to predict and therefore manipulate, but they want confirmation (the breakout) before they'll jump. The can open up a lot of avenue from selling in to strength and demand to just having a failed move that lights the snowball effect on a reversal, but this is very easily seen and I believe, purposefully constructed.

5 min EUR/USD chart.


 The same chart with the pre-requisite uptrend that must precede an ascending triangle to make it a valid consolidation/CONTINUATION pattern, Continuation is the key word as that is what technical traders expect and why it makes it so easy to manipulate a pattern like this and set traders up.

EUR/USD 5 min-for scale I added a vertical green arrow showing the start of FX trade yesterday.

 Looking at 10 min Bollinger bands on the Euro ETF, FXE, you can see the triangle constructed mostly during market hours and it's pinching the bands indicating a highly directional move can take place any minute.

 The 1 min EUR/USD chart shows clearly where positive and negative divergences have been put in to form a near perfect ascending triangle, this is why I don't think it's an accident or coincidental.

 The Euro Futures 1 min chart is nearly in perfect sync since the triangle was constructed and through it.

 The 5 min chart isn't so optimistic

The US Dollar Index is looking optimistic, it trades opposite the Euro and has a triangle , perfect volume for the pattern.

Keep an eye out for the pair, it should move trade and I have little doubt however the initial move/s go, it should end lower taking the market with it.

Market Update Part 2-Leading Indicators

We are about that time in the day where a market move can start and be sustained through the close, although the close often sees some whacky stuff, we are also at that time of day that traders are back from lunch, things pick up.

You saw the charts last week, I think my AAPL Add-To Put made my feelings on the market pretty clear. You saw a huge number of futures charts from equity indices to Currencies, etc in a number of different timeframes all confirming each other, all very ugly for the market near term.

You saw the 3C market update charts in the last post, the TICK confirming the breadth of the move and now I'm going to show you the leading indicators, as far as I can tell the only thing lending support to the market right now is the EUR/USD and I don't know if it can lend enough support, I also wouldn't say its own 3C charts back the currency pair maintaining strength much longer.

So in my opinion, everything is in place, the charts look the way they should and you'll see the leading indicators now, the legacy arbitrage of EUR/USD seems to be the only thing left and the market is not even responding to that very well intraday.

First the $AUD which is easily my favorite leading indicator among currencies because it is sensitive to China and is  big component in the Dollar Carry trade which is kind of like foot prints of hedge fund activity, a negative divergence between $AUD (red) and the S&P-500 (green) has never been a good thing for the market, it should be noted that $AUD positive divergences work well for market upside too. This divergence is pretty clear.
 
The EUR/USD (in this case the EUR component) is trading rich to the market, this "should" lift the market in a legacy arbitrage trading scheme, as stocks would appear to computers to be VERY cheap, but no one is biting. As I mentioned there's good 3C evidence on the EUR/USD, on Euro Futures and the US Dollar Index that the EUR/USD pair isn't going to be able to hold up her much longer and as far as I can tell it is the ONLY string supporting the market at all.

FCT which just happens to be one of those weird assets that has a GREAT record as a leading indicator with the market (through back testing) is in a negative divergence with the SPX.

Here's where it gets important because institutional money needs to take large positions, that's not always easy to do in stocks without moving the market, however Credit is a much larger market and they can and do show sentiment in their buying or selling of High Yield (risk on/Rally) credit or Investment Grade( risk off/flight to safety).

Here Junk Credit which is high yield because it is junk, is showing a lack of confirmation late Friday on the market's pop toward the close and it gapped down (red square) today vs the SPX gapping up (white square), so they are totally inverse or divergent, not good for the market.

High Yield Credit itself is also very telling, here it is trending down with the SPX intraday, but take a little longer view...

There's a small positive divergence in Credit at the white box and a leading negative divergence currently.

Finally High Yield Corporate Credit which is very liquid also didn't participate late Friday, it gapped down today while the SPX gapped up  and taking a look at 3C for this more liquid form of credit...

A 30 mi negative divergence, look at how small the last negative divergence that turned HYG down was, then how small the positive that turned it up was vs the current negative divergence which I showed you last week, 3C called it last week and we are seeing that being bore out today, all in all, not good for the market in Leading Indicators.

Market Update Part 1

I was going to do this in 1 full update, but there's good information here that I think is actionable and I don't want to wait on getting it out. I started to notate the charts, but I didn't think you even needed that, I think you'll be able to see clearly so I'll just put timeframes.


Other than the post last night of futures and all the confirmation between assets and timeframes, just trade today is telling you something about the market, a nice gap up and it lets go of it all, TICK moving to extremes after being so mediocre last week at the end of the week...

Since most of you probably already know what the longer or intermediate term 3C charts on the averages look like, I'm just going to put 1 medium term and 1 short term for today's action. A few charts have notations on them, then I realized you don't even need them.


 The DIA 1 min is the only and most neutral intraday chart of the averages, I just wanted to note that.

 DIA 15 min

 IWM 1 min

 IWM 10 min

 QQQ 1 min

 QQQ 15 min


 SPY 1 min

SPY 10 min.

As for breadth (as the averages' weight can sometimes be deceiving)...

Today's TICK chart, still not seeing much above +500, a little area of some +750, still very mediocre except the open, the downside is pretty consistently in the -750 with spike in the -1250 area so breadth looks appropriate for price action, I don't see any Index weighting issues skewing anything.

Quick Update

There are so many individual stocks I'm looking at and I really need to look at the broader market, I just started doing that and one of my stops was the $US Dollar index, this moves up and it's bad for the market, it moves down and it's good for the market.

This 1 min leading positive divergence in the issue falls in line with some of the other positives on longer timeframes posted in the Futures post late last night.

Here it is, pretty much in line since opening trade and then some big positive leading divergences in near term trade with solid longer term ones in place.

I'll be looking at the rest of those indicators now and getting an update out, but this looks VERY interesting for the $USD near term with longer term positives in place, this would have a negative effect on the market as a whole.

AMD Update

AMD is a long position, pretty much a longer term long position, not as long term as UNG, but not a trading position either. There was something I liked about AMD, many of us entered, saw a 20-23% or so draw down and kept holding AMD and are now back to break-even in an interesting stock (remember the trend I noticed a while back with high flyer favorites performing poorly and the beaten up bunch showing more promise).

Here an AMD update as we just start to make our way back in to the green on the position again, we didn't give up on AMD for a reason, the same thing happened with RIMM (we bought it on positive divergences before earnings, it missed on earnings and fell 9% and then made us 30-35% as we stayed long RIMM not because we didn't want to take the loss, but because the signals were strong there and they weren't about earnings, they were about a major shakeup in management).

AMD did leave a big gap open on today's nearly +11% move so that's a probable target to be filled, also an opportunity to keep on the radar.

 AMD looked like at least an intermediate trend capitulation move (yellow) and base (white) with what appears to be a break-away move today (that's only if the gap doesn't get filled). Volume thus far is on track to be quite high as it has already surpassed the normal average daily trading volume.

 The 60 min chart is handsome in AMD< it has and continued to suggest a base was being built in AMD with first a relative positive and then a stronger leading positive divergence. If this wasn't here, then I probably would have considered a stop out of AMD a while back.


 Take a look at the 5 min chart's trend, also we see some potential head fake areas as we usually see a head fake move just prior to a reversal.

 The reason it would be a a head fake is it took out obvious support, there were positive divergences on that move and look what happened shortly after the move.  This is the 3 min chart leading positive at the new lows.

 Here's a closer view of the 3 min chart with a couple of positive divergences including a leading positive in the VERY flat trade on Friday.

 The 1 min chart and 2 min suggest we are seeing profit taking in to this move, that makes sense and the possibility of a gap fill also makes sense, I'd like to see if the negative divergence can migrate over to the 3 min or even 5 min chart. This would just increase the chances of the gap being filled.

Again this is one where you might consider a trailing stop and/or taking partial profits and looking to add on a pullback, I personally wouldn't want to make that decision until I see what happens with migration on the 3 and 5 min charts.

 The daily X-Over Screen is VERY close to a confirmed long signal, in this case the yellow 10-day moving average would be where we expect to see the first pullback.


 For a trailing stop you can set up a 22 bar 60 min moving average and also watch the 60 min RSI as a potential trailing stop or you could take some partial profits right here.


The 60 min 50 bar average has held the overall trend well, this is not so much a trailing stop, but more of an overall trade marker you may want to keep an eye on, AMD should hold this average on any pullback. For a trailing stop the 50-bar 15 min has held the move pretty well, you can of course go tighter, but you cut down the ability for AMD to consolidate and move higher if it has it in it with a tighter stop.

All in all, still love AMD long here. I'd keep an eye on it for a potential long opportunity as well.