Monday, June 30, 2014

Maybe Financials Are the Way To Go, Record Window Dressing via Reverse Repo

The last day of April the F_E_D saw the second largest reverse repo (banks buy collateral from the F_E_D and sell it back the next day), this was done the last day of April which is pure window dressing to fool regulators and investors in to thinking the bank is healthier with more collateral than it actually has.

That second highest number ever for the last day of April (monthly ,window dressing) was just trumped today with a new record of $340 Billion in reverse repos submitted to the F_E_D for the last day of the quarter, remember these will be bought back by the F_E_D tomorrow through their open market's desk at the NY F_E_D. This was a $200 billion dollar increase overnight submitted by 97 financial institutions, setting a new record...WINDOW DRESSING AT ITS MOST EXTREME AND A CLEAR SIGN THE FINANCIALS ARE NO WHERE NEAR AS STABLE AS THEY TRY TO PORTRAY AS THESE SAME ASSETS GO RIGHT BACK TO THE F_E_D TOMORROW AS THE NEW QUARTER STARTS!

The bottom line is there's nearly 1/3rd of a trillion dollars in collateral shortfall among these 97 financial institutions ALONE! The irony is the banks do this the last day of the month, quarter or year end to fool investors and the banks' regulator which is THE F_E_D ITSELF!

Now you have an idea why I prefer the idea of a general short on Financials rather than trying to pick out which one has the worst balance sheet/collateral shortfall.


XLF, XLK, Small Caps

I'm looking at 3 asset groups very seriously, I think they are very near an add-to or new position area. Financials (XLF) or FAZ (3x short Financials) is one, XLK (Tech) and TECS (3x short Tech) is another, the 3rd is small caps, TZA (small cap bear 3x) is the third. I like SRTY as well as you know as it was added last week as this market has a very dangerous feel to it.

Small Caps (TNA 3x Long Small Caps)  has the exact same H&S type price pattern that the IWM so being long SRTY (3x short IWM) and TZA (3x short Small caps) defeats the purpose, take a look, it's pretty amazing how tight the correlation is.
TNA (Small Caps) in green vs. Russell 2000/IWM (red) they are virtually identical so you gain nothing really being in both trades unless you want to try for some minor diversification and take on both positions, but in such size that together they'd represent 1 position for risk management purposes, you never know, you might get a little better relative performance here and there. You definitely get better relative performance with TZA vs short IWM as it has 3x leverage, the comparable trade would be TZA or SRTY, both 3x leveraged (small caps and Russell 2000 respectively).

Since I've already started a position in SRTY, I'll probably stick with it, but the H&S tops and being at the top of the right shoulder is VERY enticing for a new or add to position in either.


As for confirmation (volume) of TNA's (3x long Small Caps) H&S pattern, here's the same quick custom cumulative volume indicator I put together so you don't have to trace volume bars at each rally and decline. The importance of volume confirmation with a H&S top and even more so with a H&S bottom is paramount, there are a lot of traders who got slapped hard from the 2010 H&S top price pattern which DID NOT show volume confirmation.

What you are looking for is falling volume (red arrows) on rallies, especially at the head and right shoulder and rising volume on declines, especially at the decline from the head and to the right to the decline from the right shoulder which we haven't seen yet. This is reversed for an inverse H&S, but volume confirmation is even more critical with an inverse H&S and both MUST have preceding up trend (for a top) and downtrends (for a bottom).

This is a solid H&S pattern, as good as it gets and with confirmation everywhere in multiple assets.

In any case, this first look is at XLF, Financials which I like a lot, the trade of choice for me on an initial break is FAZ, 3x short Financials. Getting the sector and timing is hard enough with a top, picking the right stock can sometimes be too much so going broadly with the sector, especially with some leverage (SKF offers 2x leverage short financials, FAZ offers 3x leverage short financials) for me is a better choice than an individual asset, especially if it has dividends, but there are areas and times when I prefer the individual stock over the ETF, usually after the first decline so I can see what is struggling the most with relative performance and the first consolidation/correction, then I want to move to individual names as the margin situation is better as you are actually short rather than long an inverse ETF.

 XLF is a different pattern altogether, it's much more like the SPX's 3-month range and the move above that area, but quite a bit weaker with a small double top (not a true double top) which has declining volume and RSI as well. Stops would be lined up just below support, back in the range and more hardcore longs will have stops below the range, that's also where most retail shorts would likely come in so that's an area I'd avoid if I were looking to short XLF or go long FAZ.

Just like small caps and the IWM are very closely related, the SPX has substantial financial exposure among component stocks , not as tight of a correlation as the previously mentioned, but if I were very short Financials , I'd consider that in shorting the SPX.

 XLF 60 min

XLF 15 min, I'm looking more to the far right on this chart at the small double top area.

XLF 10 min at the small double top area, there was strong distribution on the first top and then some smaller accumulation to create the second which is seeing a negative divegrence in to it, I'm also looking far to the right at the bear flag that we have seen in the market since last week, it's a bit more clear here than in most of the averages.

 This is the 5 min chart, this is the one I am watching the most before taking any new action, the flag to the right specifically is what I'm most interested in as far as any tactical entries.

The intraday charts at 1 min as it is the fastest, would go negative first and if the divergence in the flag area is strong enough (negative), that 5 min chart should go negative and then we have more or less a full house across all the timeframes, here you can see that process has begun.

And at the 3 min chart, just below the 5 min, it is migrating to that chart so I suspect it will hit the 5 min chart soon, perhaps later today or tomorrow. I also have to consider the resistance formed by the two small tops, as that is a possible head fake area as the resistance is very close at both, so I'll be watching that. If there's a head fake move above those two tops or bounces, I'd seriously consider XLF puts so long as there's solid confirmation that it's a head fake move.

More to come...

AAPL Trade Set-Up Follow Up

Friday I posted this specific Possible AAPL Call Set-up in which we wouldn't be chasing it, but rather looking for a pullback type of move to enter some calls for a bounce that I have been expecting in AAPL for about 2 weeks. This could be played long AAPL equity as well, nut I think the calls are a better option, there's less resources tied up and there's a much better return on what I'm looking at as more of a bounce play. The end of window dressing (July 1) tomorrow, may give us the opportunity. For the major part of the set up and why I like AAPL I'll let Friday's post stand, Possible AAPL Call Set-up.

As for today's developments, I just want to update the short term charts and set some new alerts below today's prices to Friday's close as I already have alerts set for prices below Friday's which is the Call Set-up trade so long as the charts remain positive.

 AAPL's 1 min chart which had a negative divegrence for the set up Friday and still does, but it went positive in to the last hour of the day.

You can see the initial positive divegrence sending AAPL up the last two days, it's not very big and only a 2 min chart, this is why I suspect AAPL will pullback before making any significant bounce worth trading.

 The 3 min chart shows the same, but for our purposes, it's the 3 min negative currently that is interesting as that is forecasting the near term, minor pullback I'm looking for to set up call options in to such a pullback-see Friday's original post idea.

Finally the 5 min chart doesn't show the accumulation for the near term move of the last few days, this is why I suspect AAPL will pullback and offer us a nice entry with much lower risk and a much better entry point, plus we have the advantage of being able to confirm that it's a constructive pullback and still a high probability bounce.

SCTY Follow Up-Charts...

As mentioned in the previous post, there are two recent posts covering SCTY as a trade set-up, I just happen to like where it is sitting right now and the way it is behaving and would like some exposure to it.

Here are the charts...
 This is the H&S top, the right shoulder is a bit extreme, but considering the momentum in this stock and window dressing, I'm betting a lot of that action is/has been window dressing.
 The right shoulder has a bit more volume than it should have for the price pattern, but the declining volume in to the rally is exactly what H&S volume confirmation is all about.

 I'm using the blue version of 3C on these charts, the orange version from previous posts is giving the same signals, but considering the momentum in this stock and the industry group, the faster blue version is more appropriate.

At each of the significant top inflection points through the entire H&S we have a leading negative 4 hour divegrence.

This does not have a significant daily negative divegrence, that's one of the reasons I went with a half size position, but it's also a relatively new issue with less than 2 years of trading.

This is the 60 min chart from confirmation to a leading negative right at the top of what looks very much to be a right shoulder which is inline with many stocks in the momo category as well as the IWM/Russell 2000 which is excellent overall market confirmation.

 The 30 min chart shows the same, the only thing I question is whether we get a head fake forming the Chimney that is often seen in these rounding tops, "Igloo with a Chimney", that's the kind of event that I'd use to add to the SCTY short position and bring it to full size and still have alerts set for a gap up warning me of a potential chimney so I can quickly look at it and decide whether to add or not.

 The 15 min chart with accumulation, not anything spectacular, but enough to get SCTY off the neckline and in to a right shoulder rally, note the stop-run/head fake move just before the upside move began, it is this kind of move we see about 80% of the time before a reversal in all assets and every timeframe. That is also why I'm looking for a possible chimney at the top of the right shoulder as it is the exact same concept.

 10 min, just showing confirmation through various timeframes.

The  intraday 3 min chart looks like a good timing signal, as do the shorter charts.

 Like this 2 min, this seems to give us a very clear timing signal as market makers and specialists typically will position themselves (their trading of their own account in stocks they make a market in use to account for about 30% of the stock's daily volume) just ahead of an anticipated move as they are often the ones who filled a large order and know when it's about to move so these shorter timeframes tend to be useful for this kind of timing, just like they showed Friday's 1:15 crash on no news, no catalyst at least 30-45 minutes in advance, that appears to be market makers/specialists, maybe HFTs getting out of the way intraday in anticipation of something they know is about to happen.

And the 1 min chart.

I will probably have a stop of something like $75.60 or so on a closing basis, I don't want this one getting away from me, but I'll also consider what the charts and market tone looks like. I'm giving this a wide stop because of its volatility and just taking on fewer shares to allow for a wider stop. The way margin works with most brokers, a position of the profits from a successful short can be put to work and the short can be added to, unlike a long position in which you have to close it to have use of the gains or inverse (short) ETFs which you buy long.

I wrote an article about how it is possible to make more than 100% on a short as that is one of the arguments against shorting stocks, that they can only go to zero (100% gain), but this is actually not true, you can make more than 100%, here's the article, Making More Than 100% on a Short

Trade Idea: (Swing Trade Plus) SCTY

I'm going to open a partial (half) size SCTY equity short here and will consider adding to it if there are any unique developments that have high probability outlooks like the gap up with distribution that would be a high probability bearish confirmation Engulfing Candle, in fact I might even wait for something like that to be formed.

 This is a H&S-type price pattern and at one of my favorite places to enter, the top of a right shoulder, although the volume pattern is roughly correct, it's not perfect. I'll add charts in the next post, but I have covered this one recently here, Trade Idea/Set Up: (Longer Term) SCTY and here, SCTY Update , History and Market Dynamics as a Proxy.

I am entering this as an equity short, not options although I don't rule them out, especially if there's an extreme price move that lowers premiums and can be easily confirmed as a head fake move.

SLV Update / Trade Management

Silver, gold and miners all looked like they were set for a real pullback last Friday, thus the reason I took the rest of the NUGT position off the table, but I'm not excited at all or even interested in trying to play DUST (the inverse of NUGT) for a NUGT pullback, gold miners are just too strong.

Looking at SLV and GLD helped me make my decision re: the NUGT position Friday

We have a current SLV July (standard) $20 Put position that is now in the green, I'm going to kkeep that position open unless I notice anything that looks to threaten it, I'm also setting price alerts for > $20.10 and $20.15 where there's a gap as I may be inclined to add to the position or call it out as a new trade opportunity.

For now,
 60 min SLV with a clean, clear confirmation of the uptrend and a clean, clear leading negative divergence, not large enough to ruin the new trend, but enough to fill the gap and maybe some.

The same out to a 30 min chart.

And for timing purposes, the 10 min leading negative and what was most important for my decision on Friday...

The intraday 1 min looked very clearly like it was ready to start the correction.

The 2-day trend channel which is about right for SLV has a stop around $19.10, this may be a bit shallow for a first pullback of a new trend, but it is also in the region of...

The X-Over chart's 20-day moving average which is a typical pullback area for new trends as this just gave a recent  long signals (white boxes).

I'd consider adding or starting a new position above $20.15 on an intraday bounce/correction.

USD/JPY having effect on broad averages, Chicago PMI Q2 Disaster coming?

The USD/JPY was ramped a bit in to a negative divegrence which has taken hold of the carry pair and is now taking hold of the broad market in general.

There's also Chicago PMI released shortly after the market open that suggests Q2 GDP may not be a positive print which would mean the US would technically enter a recession, we do have several more important data points this week so we'll have to see the trend, but Ch-PMI is not a positive development toward Q2 GDP and the possibility of a US recession.

USD/JPY pumped in to the US open in to a negative divegrence which is obviously falling.

Chicago PMI for June missed at 62.5, biggest miss in 3 months. Inventories were up, Order Backlogs were down, New Orders were down, the only silver lining was an uptick in employment, which is good news that is actually bad news for equity bulls looking for F_E_D accommodative policy.

Over in Europe, the ECB released an update, household loan creation and loan creation to non-financial industries is falling horribly. Private loans fell 2% y.o.y vs -1.8% from April, loan creation is just barely above its all time record lows from late 2013. To contrast this and give you some perspective, loan creation was +11% around the market top in 2007. This in addition to nearly a trillion dollars in non-performing (bad loans) that are already sitting on European bank balance sheets. Loans to households fell $42.8 billion Euros which is the largest decline on record.

Loan creation to households to the far right in gray.

It seems the Bank of International Settlements words of scorn of Central Bank policy being a quick fix that leads nowhere were very timely with this morning's data points so far, but it's still a very heavy week of data for such a short week, Non Farm Payrolls Thursday will be a biggie.

Opening Indications

Thus far it seems the concept of 3C picking up where it left off on the previous trading day (Friday) is holding as we were negative through intraday timeframes (1-2 min.) on all of the averages at the close.

As for Precious metals and the one I was really worried about, NUGT from Friday, Closing the Rest of NUGT Long Position they are down with GLD only down -.10%, SLV down about 1% and NUGT - 2.56% and GDX -.89%.

Charts...
 DIA with a negative intraday as of Friday, not responding great off the open thus far.

2 min DIA

 IWM 1 min negative.

 IWM 2 min relative negative

 QQQ 1 min negative Friday intraday

2 min QQQ negative

SPY with Friday's pre-1:15 divergence and closing...

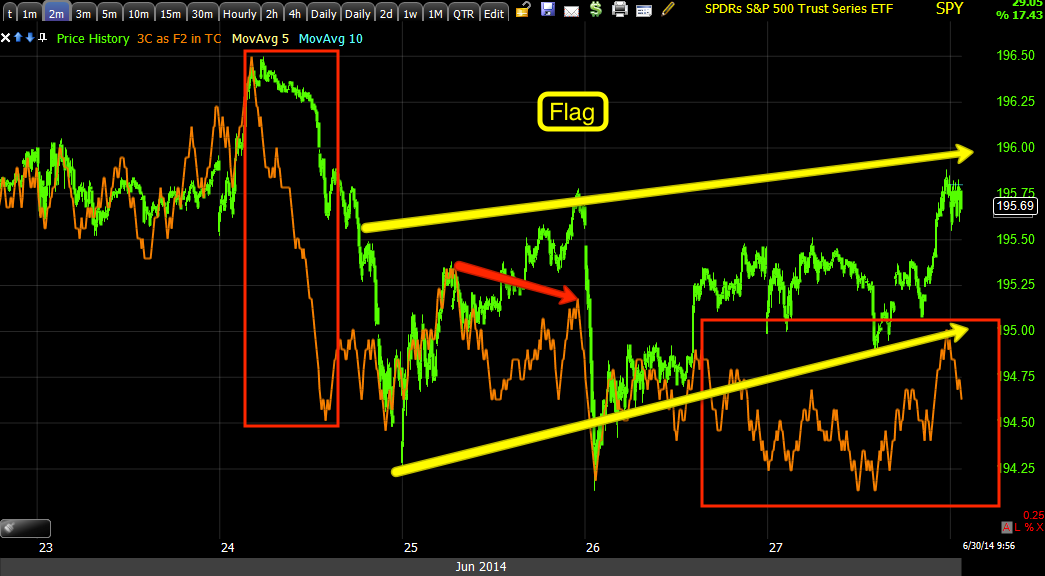
And this is the most immediate question I want to answer, how does this bear flag, which looks to be intentionally started as there was enough accumulation to halt the previous decline and start the flag's consolidation/correction which was distorted by a sell-off premarket on the F_E_D, "The market is wrong" comments.

This flag will likely be the most important near term set up price pattern as it does look very intentional.


Last Day of the Month and Quarter as well as Window Dressing

Apparently all that millisecond action driving stock prices higher within a short period of time late Friday afternoon as shown by NANEX, were Russell 2000 stocks being added or deleted from the index, I don't quite understand howe this worked, but someone front ran the front runners, in any case, they were all R2K additions or deletions. Interesting market.

This is also a very busy eco-data week and shortened trading week, the NASDAQ and NYSE both close at 1 p.m. on Thursday forcing data like Non-Farm Payrolls to be released Thursday. Friday all markets are closed due to the 4th of July, it should be interesting.

We also have the ECB meeting on Thursday.

It was a light news flow over the weekend except  Baghdadi of the ISIS insurgency declaring a Caliphate and crucifying 9 rebels who were considered, "too moderate", this means he expects all in areas under ISIS control to swear allegiance to him including Al Qaeda. The other news was the Bank for International Settlements, the central banks' bank,  essentially accused world leading central banks of taking the easy way with policy over the last several years which has gained them nothing in the end (a 5- year low in Q1 GDP after nearly 4 trillion in F_E_D balance sheet expansion) and was dumbfounded by the market's disconnect from reality, further adding that balance sheets of Central banks are stretched so thin that they may not even be able to respond to an ordinary recession much less something worse. We are one more negative GDP print away from a recession in the US.

Overnight activity in the Index futures has been relatively flat with Asian equities showing a mostly positive bias.

Crude has lost more since the open of futures for the new week, strange considering the escalation of the new Caliphate declared by  Baghdadi. Gold also seems to be pulling back a bit as expected as well as silver.


Sunday, June 29, 2014

Frist the D_E_D, then the F_E_D, now the Central Banks' Bank, BIS Slams Markets' Exuberance

Those of you here for the last few years know that we knew the F_E_D was looking for an exit long before they actually announced an exit, it really wasn't that hard to figure out if you listened and watched what they did. The F_E_D is actually quite transparent via policy moves like adjusting guidance from a qualitative (date based) to a quantitative (result based or arbitrary as results are easily manufactured or manipulated) model.

It wasn't but a month or so ago that F_E_D speakers were almost in unison declaring their concern for the ultra-low volatility (lack of respect for market risk) permeating the markets, which is one reason many people found it shocking when Yellen said after the F_O_M_C policy decision, during her interview that she wasn't that concerned about market complacency.

Where have we heard former F_E_D chairpersons make such statements? Bernanke's, "Subprime is well under control" or maybe Alan Greenspan's "Housing prices will never go down".

In any case, we were recently reminded by none other than moderate policy dove, James Bullard (President of the St. Luis F_E_D) that the market is essentially, "WRONG" and it doesn't understand how close the F_E_D is to accomplishing its goals, read as RATE HIKE) and if that were too subtle, he suggested rates may be hiked as early as Q1 of 2015, by far the earliest estimate any F_E_D official has given, causing the market to sell-off hard on volume pre-market, to only drift back up last week in what looks to be a market induced bear flag.

Today we have the Bank of all Central Banks, the Bank for International Settlements (known as the central bank's bank) coming out in their 84th annual report.

From the FT: "

"Overall, it is hard to avoid the sense of a puzzling disconnect between the markets’ buoyancy and underlying economic developments globally."

"The Bank for International Settlements has warned that “euphoric” financial markets have become detached from the reality of a lingering post-crisis malaise, as it called for governments to ditch policies that risk stoking unsustainable asset booms."

Also that leading central banks should not fall in to the trap of, "Raising rates too slowly or too late". (If you want to know what the market fears more than anything, it's the F_E_D raising rates, it is a bear market creator in itself).

The BIS warned of crisis' brewing in emerging markets, not the least of which included China.

"

The global economy continues to face serious challenges. Despite a pickup in growth, it has not shaken off its dependence on monetary stimulus. Monetary policy is still struggling to normalise after so many years of extraordinary accommodation.  Despite the euphoria in financial markets, investment remains weak. Instead of adding to productive capacity, large firms prefer to buy back shares or engage in mergers and acquisitions. And despite lacklustre long-term growth prospects, debt continues to rise. There is even talk of secular stagnation." Which is one of the things I've been considering more and more as inflation mounts, the economy going in to a prolonger period of stagflation, remember we are only 1 more negative GDP quarterly print away from recession right now.

"Financial markets have been exuberant over the past year, [...] dancing mainly to the tune of central bank decisions. Volatility in equity, fixed income and foreign exchange markets has sagged to historical lows. Obviously, market participants are pricing in hardly any risks." Which is dangerous considering we are at 1 of only 4 times the market has been this over-valued, the previous 3 times were 1929, 2000 and 2007 and we know how all of those years ended.


"Growth has picked up, but long-term prospects are not that bright. Financial markets are euphoric, but progress in strengthening banks’ balance sheets has been uneven and private debt keeps growing. Macroeconomic policy has little room for manoeuvre to deal with any untoward surprises that might be sprung, including a normal recession" Don't forget the April F_E_D's 1-day reverse repo at quarters end being the highest ever recorded as banks borrowed money for the very last day of the quarter from the F_E_D to make their balance sheets look stronger than they actually are, the biggest 1-day repo ever in F_E_D history on the last day of the month (reporting period).

As for monetary policy has little room to maneuver in even a "normal" recession, that's because the F_E_D has blew it's balance sheet already over the last 5 years in nearly 4 trillion dollars of expansion with assets easily purchased by creating money out of thin air, but very hard to sell without taking massive losses, thus the reason the F_E_D has no choice but to try to hold them until maturity...Meaning, the F_E_D has lost its firepower to deal with the next crisis as they've blown it all on this one to get nothing more than the worst quarterly GDP print in 5 years!

"Low corporate bond yields not only reflect expectations of a low likelihood of default and low levels of risk premia, but also contribute to the suppression of actual default rates, in that the availability of cheap credit makes it easier for troubled borrowers to refinance. The sustainability of this process will ultimately be put to the test when interest rates normalise."

"The developments in the year under review thus indicate that monetary policy had a powerful impact on the entire investment spectrum through its effect on perceived value and risk. Accommodative monetary conditions and low benchmark yields – reinforced by subdued volatility – motivated investors to take on more risk and leverage in their search for yield."

"Never before have central banks tried to push so hard." Few realize it, but just prior to the 1929 crash, the F_E_D was involved in Quantitative Easing. Japan's massive QE program has been a failure since launched and is accelerating.

"As history reminds us, there is little appetite for taking the long-term view. Few are ready to curb financial booms that make everyone feel illusively richer.  Or to hold back on quick fixes for output slowdowns, even if such measures threaten to add fuel to unsustainable financial booms. Or to address balance sheet problems head-on during a bust when seemingly easier policies are on offer.The temptation to go for shortcuts is simply too strong, even if these shortcuts lead nowhere in the end." Did mommy just slap daddy at the dinner table? Calling Central Bank policies a quick sugar high fix that leads to...nowhere? Sounded that way... To my understanding, there never has been a Central Bank inflated bubble that has failed to burst... My interest in VIX futures (At the right time and place) is very much renewed.