Monday, April 20, 2015

XLF (Financials) & FAZ Update

I've been popping through numerous watchlists as often as I can between looking at the market and other things. Today I decided I'd post a larger XLf (Financials) using FAZ (3x leveraged Short -Inverse Financials) and FAS (3x leveraged long Financials) as part of the multiple time frame/multiple asset confirmation.

While ETFas are managed to (typically) track the 1-day performance of the underlying asset (for example SPY tracks the S&P-500), while the percent change is usually very close (even for the 2 and 3x leveraged ETFs), the actual volume or "demand" in the sense of volume, is not matched and totally different. I've mentioned numerous times that I often find leveraged ETFs give signals earlier than their non-leveraged counterparts or underlying asset. I suspect this is because the leverage makes timing more pertinent as gains and losses are magnified by the leverage. In any case, since 3C uses TSV-based data for its input which is Worden's proprietary indicator, "Time Segmented Volume", you can see just by the name that 3C and TSV use volume as a significant part of the calculation, thus despite the related ETFs tracking similarly, the demand component is very different, which is one of the reasons I use different assets in the same sector to see if there is "Multiple Asset Confirmation".


I would say that XLF broadly is in a good position to see a downside move of consequence, in saying "consequence", I mean I believe this is well beyond a 10% pullback or the media's 20% number they like to use, I believe we are looking at a primary trend move to the downside which means the October lows taken out and continue to move to lower lows. There are numerous fundamental catalysts for Financial weakness specifically, not the least of which is the contagion from a Greek default/exit which we'll touch on in the Daily Wrap.

In any case, here are the charts for XLF, FAS (3x long Financials) and FAZ (3x short Financials)...Remember, XLF and FAS should have similar confirming signals, FAZ should have nearly opposite 3C signals for confirmation.

 The trend in XLF (Financial sector) on a daily chart which seems to have run in to another large triangle-based price pattern. Triangles this size are not consolidation/continuation patterns, they are far too large. Typically a large triangle like this following an extended uptrend is a top, a large triangle following an extended downtrend is typically a bottom.

Note the increase in volatility or "Peeling" away from the trendline after the trendline is broken at the October lows with upside volatility after the October lows and in to a tightening, pinching range like many other of the averages, sectors and stocks.


 Taking a closer look at the apex area (point of the triangle which usually sees a highly directional price move as the apex comes to a point just like inched Bollinger Bands), there seems to be a bear flag of sorts (not textbook as far as the preceding trend). Volume is also not correct for a bear flag, but this does seem to be some organic price pattern.

Friday's break below the flag and close right at support is the perfect signal on increased volume for a bounce such as we saw today.


From my normal perspective, given the rather narrow range of the flag, I'd be looking for a short XLF entry or add to above the top end of the flag's range, a Crazy Ivan shakeout. I'd be looking for short term charts to confirm distribution above the range for the entry above $24.60 which is where I'll be starting my price alerts.


The long term 6 hour chart of XLF is showing the last major accumulation at the October lows and significant strong distribution in to 2015 and through the triangle area.

This is FAS-3x long Financials on a 4 hour chart, also showing the same October lows accumulation and leading negative distribution signals in to the triangle area.

The FAZ 3x short Financials is showing a confirming leading positive divergence.

XLF 30 min also shows with more detail (stronger divergences) the same exact trends as the multi-hour charts in all 3 ETFs, significant October lows accumulation and leading negative divergence that have grown stronger in to the triangle.

FAS 30 min chart (same timeframe as XLF above) shows the same thing, accumulation at the October lows and leading negative distribution in to the formation of the price triangle.

FAZ which is the 3x inverse of both, confirms on the same 30 min chart with a leading positive divergence, note longer term though the October highs in FAZ on all of the charts October highs which would not surprise me as I believe this will be one of the biggest movers.

This is XLF's bear-flag-like area at the yellow arrows. Note the recent leading negative trend on the 15 min chart, the same 15 min charts I have been watching in the broad market for turns to the downside, all of which have done so with SPY catching up last week.


FAZ being the inverse shows the area like a Bull flag and has positive divergence in to the flag-pole and the flag with only a small recent negative on the move in the market expected today from Friday's Week Ahead post.

FAS 10 min with a larger leading negative divergence on a 10 min chart in the bear flag area similar to XLF.

Note April 2nd where the overall forecast for a market bounce based on the triangle's all coming to an apex and the 3C chart action since that forecast moving forward in to price gains with a strong leading negative all last week leading to Friday's lows, which is interesting, unless the market knew a week in advance about the Chinese issues Friday...

Now to the tactical time frames, XLF 5 min with the same leading negative divergence leading to Friday's lows, there's no confirmation whatsoever of today's oversold bounce expected market wide from Friday's "WEEK AHEAD" post.

And FAZ 5 min is confirming with an equal/opposite leading positive divergence leading to Friday's gap up.

XLF 2 min is just showing us a closer timing signal going negative in to last week and Friday's gap down, again no positive divergence even on a 3 min chart, suggesting any upside we can get in Financials is a gift from here, although I still like them broadly speaking in this area for the primary trend or trend trades.

XLF 2 min shows a weak (2 min) leading positive divergence in to Friday's FLAME OUT area in the afternoon as stops were run and accumulated for an oversold bounce. Note today's 3C distribution signal in to the oversold bounce today.

1 min XLF is pretty flat, this will likely be the "timing" timeframe for actual tactical execution of a trade idea.

While the 1 min FAZ is already in a leading positive divergence.

I'd set price alerts for slightly higher XLF and slightly lower FAZ prices, hopefully this gives us a good chance to enter at a tactical area of lower risk, higher gains while also getting in on what appears to be a significant strategic trend change coming.


Quick Market Update

I don't think today's move is quite ready to roll on us, there may be some additional upside which is on very short term charts, the base or lack of a sturdy base is problematic. I suspect it may take some fundamental information (not technical) to cause a head fake move based on the SPX March resistance line, I don't see the market as having the strength itself to pull that off without some kind of F_E_D speak or something along those lines.

The charts that needed to fail, largely have and instead of looking at 15 min charts for signals, we are now down to the nitty gritty of intraday charts, 1 min in many cases.

I'll post examples in the Daily Wrap.

I also have an XLF/Financials / FAZ post that will be out soon.

Remember Volatility?

If you recall the posts that talked about the stages of a market or stock's cycle, accumulation, mark-up, distribution and decline (stages 1-4), you've probably heard or seen the examples of how volatility precedes the transition from 1 stage to another, often in surprising ways that are what I call "seemingly" bullish or bearish, but all the while the main concept is "Price is deceptive".

It's true that price is king, but that doesn't make it any less deceptive at times. I don't have any argument with someone that sees an AAPL update and wants to try to catch the bounce up, as long as they understand the risk and see the underlying trade, that's a personal choice that 1 trader may be better suited for than another due to time constraints, account size, risk tolerance, etc. I'd rather be buying something that is showing accumulation personally. However for most people, they don't see what we see, underlying trade, therefore the "Price is kins" meme can often and according to studies, often sees people lose all bull market gains when the market turns to a bear market for a number of reasons that are too long to go in to for this post, but suffice it to say that when you have a good experience with something, you develop cognitive biases.

The actual point was volatility and the surprising "seemingly" this or that price moves before a trend change from 1 stage to the next. From a stage 1 base to stage 2 mark-up, it's very common to see a new low made and run all of the stops before a big move to the upside. Before stage 2 rally/Mark-up turns to the lateral stage 3, it often peels away from long term trendlines in a "Seemingly" bullish parabolic move (look at Gold/GLD 2011).

One of the things I have warned of and am watching for is the typical topping "Igloo with Chimney" head fake short squeeze we often see whether on an intraday chart or a 5-day weekly chart, right now that would be the SPX daily trendline from March...
While not the "Igloo / Chimney" price pattern, the chimney is a head fake move on a rounding top just before a downside reversal, a breakout above a well know resistance line in the most watched Index in the US, maybe the world, would perform the same conceptual function.

The end of stage 4 decline or a bear market tends to end with a BANG, a big gap down on huge volume known as capitulation, however price tends to drift lower more slowly after that for a bit before starting a stage 1 base again, but the point is the RISING VOLATILITY WHICH IS ONE OF THE MOST IMPORTANT THINGS I HAVE BEEN LOOKING FOR RECENTLY IN THE MARKET'S PRIMARY TREND FOR A TRUE BREAK OF WHAT I BELIEVE IS A LARGE BROADENING TOP FOR THE SPX.

I'm trying to get us as close to the right edge of that cliff without getting stuck in this...
 This is the DIA 10 min chart with huge volatility, but not going anywhere as the Dow was RED TYD as of Friday and is up +1.19% YTD today. It's this chop and more specifically the chop within moves and pinching volatility as of the start of April, that has made short term trading very difficult unless you have been in and out and watching exceptionally close. I don't know how many times I've posted, "The market is green for the year" and then "The market is red for the year" through 2015, THAT'S A CHANGE IN CHARACTER ALONE THAT SHOULD TELL YOU SOMETHING ABOUT THE BROAD MARKET IN TERMS OF THE PRIMARY TREND SINCE 2009.

That's fine, it's the increase in volatility I'm most interested in as a signal.

 Looking at the Dow daily chart, this looks like a swing traders dream and we have called just about every swing this year, but take a closer look at the day to day candles and imagine not knowing what happens, what's on the right side of the chart tomorrow? Look at the approximate swings/Volatility day to day for the Dow alone marked by arrows of approximate size of each days swing and whether up or down....

 Things are a lot easier to see once they've happened, but at the right edge of the chart, it's not so easy, especially with swings with that much intraday or day to day volatility.

Still, remember the 15 min charts which were 1 of 3 indications I've been watching to find the pivot in this market on a primary trend (in my view)?

That's the DIA 15 min chart, the chart that was positive when the April 2nd forecast was made, the chart I've been watching to turn negative.

As for ES, it's hard not to just jump all in right now,,,
60 min ES/SPX E-mini futures. The positive divergence in to early April is clear as is the leading negative divegrence now, an even stronger signal than the DIA 15 min above.

So as you can see, I'm doing the best I can to keep us out of that choppy mess, but not miss the pivot because there are very clear large signals that I believe likely represent the primary trend (as in since 2009) and a very likely trend change in that primary trend.

The increased volatility whether up or down is a good signal for us and remember that the "seemingly" strong price move is often the reddest of flags,


USO Update

USO calls that are counter to the large 2015 base, are hard for me to make because we were the earlier to recognize a change in USO, the earliest as far as mainstream media to say it looked like a base, but not a base that was finished while others were calling it a base about 2 months ago and it has great longer term signals, great overall base signals and off price action alone, looks like it's ready for a base/upside breakout, not a false break used to trap longs and push prices back to the lower end to make the base larger/stronger, but based on price alone it looks like it is just waiting to gather enough steam to breakout and

I'm a huge fan of that eventual move.

 This is the "W" base in USO, it even has a head fake move at the second low of the "W" or Double Bottom, which is why I say that from a price based perspective alone, it looks near ready to go.

However a closer look at the Daily candlesticks from the last resistance level and this tag of resistance shows the same long upper wicks indicating higher prices are being rejected as volume falls off as well.

It's more the 3C charts though that make me thing a swing pullback which could be near 20% is probable as you see with this 15 min USO negative divegrence between the same two areas seen on the chart above this one.

 The 10 min negative from the most recent swing up to resistance and a relative (weaker) and then leading (stronger) negative divegrence.

The shorter charts like 3 and 5 mins above show the same negative in the area of resistance.

As does the trend of this 1 min with accumulation and distribution on a very short term basis, thus  for now I'll stick with USO. A break to pull in new longs and trap them wouldn't be unusual, if I were the crook moving oil prices, that's what I'd do, after all a failed breakout is a fast reversal.


AAPL Update & Market TIMING Proxy

Our original 4/2 market forecast which has been pretty darn accurate was made using all of the information I could gather which included going through numerous watchlist stocks and noticing a common theme, that's when I posted the forecast/update and since I had seen enough as I had looked at the AAPL chart and because it was the easiest, cleanest chart to use a proxy for the broad market, that's what I used.

As you know from Friday, I suspected AAPL was going to use a Crazy Ivan shakeout for (head fake) slingshot momentum to the upside, but this wasn't the first call for a move higher in AAPL based on its triangle, the original 4/2 post also called for it and last week's AAPL Finally Looks To be Making a Move called for the same, so I'm happy to see the move whether you played it for a piggy back (short term long trade) or are just interested in it as a short or market proxy like I am. AAPL charts look to be fantastic market timing indications which is important in picking the best pivot without the kind of chop you would have seen last Friday through today.

A Crazy Ivan Shakeout like this one embodies everything, all of the reasons head fake trades exist, why they work, what the psychology is, what the probabilities are and how you use them to your advantage (all in the "Understanding the head fake move" articles (2) that are always linked at the upper right side of the site.

This was a suspected Crazy Ivan shakeout, today it looks to be a confirmed on, thus as both a trade idea and a broad market proxy for timing, it's of great interest to me.

 First, the long term highest probabilities...
 4 hour AAPL deeply leading negative right at this triangle.

The 10 min chart shows the right side or Apex of the triangle, the head fake/ Crazy Ivan shakeout and accumulation of that move Friday...

So now we look at the charts, whether there's distribution in to higher prices as always expected or not and at what pace if so. This is the concept of "Migration" or the strengthening of a divergence.

 intraday 1min AAPL shows a negative divegrence building.

 It has already hit the 2 min chart, in a rounding type price action.

We already have signs of it on the 3 min chart as well so there is a negative divegrence building/migrating across longer timeframes in AAPL. If I zoom out you can see the positive Crazy Ivan divergence, but you'll see it below, I'm trying to focus on the migration of today's negative divegrence.


This 5 min chart shows the positive divegrence as the Crazy Ivan allowed smart money/specialists/market makers/etc. to pick up AAPL on the cheap and in supply on the head fake/stop run or Crazy Ivan shakeout, thus the divergence.

From a practical point of view, I'd say when AAPL's 5 min and 10 min chart are showing decent negative divergence as this process keeps moving to longer charts, the timing for the overall broad market will be there, not only for today's gap fill move, but on a larger basis as AAPL was one of the disappointments and I thought maybe my analysis was wrong being it HAD NOT broken out, but now it has done what I was looking for, it looks to be an excellent timing indication for the broad market which will include MOST stocks as well.


Market Update/Leading Indicators

Nothing unusual, so far A GAP FILL

Everything today looks as expected with slight variations like we didn't get an early pullback to form a wider "W" base this morning before filling Friday's gap, but otherwise everything is right on track thus far and it's a matter of determining where/when the gas runs out. Can the market make that SPX head fake move? When are the most stocks on watchlists at the point of critical mass as far as Trade Ideas, etc.

Leading Indicators are calling today's move for what it is, a gap fill on unexpected news from China that likely left the middle men in transactions holding inventory at higher levels from Thursday's close and at a loss, thus in need of a gap fill, but I have mentioned the SPX clean, clear resistance trendline and head fake possibility which I'd normally put at an 80% probability ( a failed or false breakout which are excellent for entering put positions or other positions, I especially like it for options though). The 80% probability is based on years of monitoring of the market, seeing this concept happen in every timeframe and every asset usually just before a strong reversal in trend and I men just before which is also why it tends to be one of the best price-based timing indications for a price trend reversal (down in this case). However, as clean and clear as the SPX trendline is, it's hard to imagine an 80% probability, even though the larger the turn, the more probable a head fake, the market has just been that weak all year. You may recall that I've written numerous times, "I don't know how many times I've written the averages are green YTD or the averages are red YTD", which is something that happened to quite a few just on Friday's price action alone.

As for Leading Indicators, they are showing the kind of signals thus far I'd expect, you'd expect if you've spent a month or so looking at Leading indicator posts, in this circumstance of at least a gap fill from Friday which the market has been relentless about whether oversold/overbought or not, just something that has occurred with increasing frequency to almost the point of guarantee as HTF's have become more dominant in the market.

Another concept that has been strong is that of reversal candlesticks, especially on volume. You'll see on the Leading Indicator charts below, areas marked as last week's forecast "reversal process". Normally with a reversal process we have a price pattern that looks like an "Igloo with a chimney", the Igloo is something like a rounding top, part of the reversal process and the "Chimney usually comes just after the rounding top starts turning down and it is the head fake move that breaks above the top of the rounding price pattern and usually on non-confirmation, thus in this case if it were to occur, distribution which is how we know we can use the price strength and underlying weakness to enter positions and use the price strength to our advantage or use it to close a long at the best price.

Note the reversal candles, both bearish and bullish and note the ones that have increasing volume over the previous day, it doesn't have to be huge, just increasing. These candlestick reversals on higher volume tend to work about 3 times better in my estimation.

To the right in the yellow box are two candles forming a bearish "Tweezer" top, as well as the second candle on the SPX actually an inside day or mini Harami bearish reversal, this is the area of the reversal process forecast for last week. Friday's candle has a longer lower wick, not the minimum 2x longer than the body that is the way to tell a "Hammer" bullish reversal, but it's the psychology of the concept, not anything unique about how long the actual wick is. This shows lower prices were rejected Friday, which came right after our afternoon flameout. The increasing volume makes this a much more probable reversal candle even if it's not a textbook "Hammer" bullish reversal in to today- the psychology of the candle is the same even if it's not textbook and the volume is the most telling part.

Leading Indicators. not strong, in line with today's expected move...
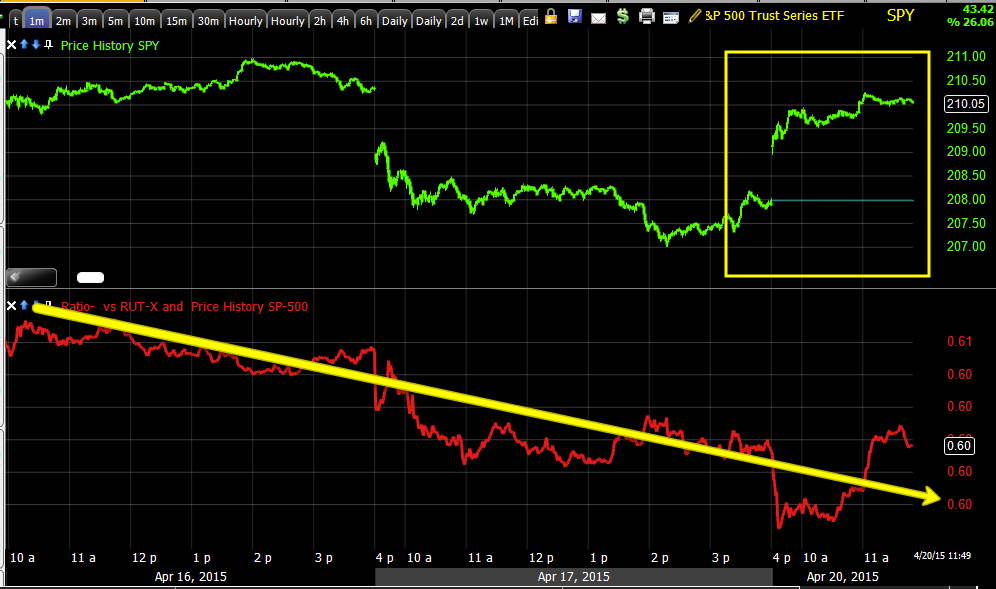
 The SPX:RUT Ratio (red) custom indicator is NOT confirming even short term SPX price action above today, but rather is in line with the trend.

If you look close at the 'flameout area" from Friday afternoon, you can see small intraday support by the SPX:RUT ration as it fails to make the lower intraday low/stop run.

 This is the same chart, normally the indicator should confirm price action, when it doesn't, that's a divergence/signal, it's not confirming today's  move.

 Our Pro sentiment indicator is not confirming within the trend either since last week's reversal process.

 HYG HY Corp Credit went negative at the Tweezer top and is also negative intraday vs the SPX.

 10 year yields through 2015, remember yields in red tend to lead the SPX (green) like a magnet.

A closer look at the non-confirmation in today's gap fill price action in yields (10 year) as well.

5 year yields also not confirming today's move.

Nor are 30 year yields either intraday or full year 2015.

Commodities which were helping support part of last week are not confirming either.

And the same is true of High Yield Credit, so while I didn't expect to see anything much different than this, I am glad to see the confirmation of the expected.

TICK (NYSE) intraday breadth is reasonable all things considered, but far from impressive.

Indicative of the recent price moves, the custom TICK/SPY Indicator makes near perfect sense...
Just follow the TICK/price trend, today is not strong as mentioned above in the Leading Indicator section.

As for the averages... This is a near perfect example for all of the averages...
 intraday 1 min charts like SPY above , are either in line like this is close to, slightly leading like DIA or slightly negative like IWM (below).

However, the strength was really built Friday on the flameout at about the 3 min chart area.
 2 min SPY seeing deterioration and that is moving to the 3 min charts.

SPY 3 min

QQQ intraday 1 min looks worse, but there's a moix in the weakest intraday 1 min charts, the theme is at 2, and 3 min.

2 min QQQ looks similar to SPY, 3 min starting to deteriorate and that's the same theme for the DIA and IWM.

This is also fitting with the Leading Indicators.

I want to be careful not to waster possible head fake momentum, but also want to get the pivot point right, so it's a matter of watching these charts, how quickly they degrade, whether there's maybe some outside influence that could spark a head fake move as the charts themselves certainly don't appear to have the gas as they never build that stronger second low talked about Friday and you can see the result in the charts above.

It's just looking at the market and looking for the highest probability message or that glimpse of something that is rare toy see, but tells you a lot. Otherwise, I can't say this looks any different than if I were to have guessed at the most probable look to the charts Friday night.


Market Update

Friday numerous posts talked about the gap down and the losses middle men like market makers, specialists, HFTs that are essentially providing the same service by front running the middlemen with their speed, weren't likely to let the gap down, on broken Bloomberg Terminals and several news items/regulatory items from China that were, "unforeseen".

As of Friday, I had suspected we'd see some attempt to fill the gap early this week, but once seeing the internals in the Daily Wrap as suspected from TICK data intraday , as reposted in the A.m. Brief earlier this morning and how near term oversold we were on a 1-day basis, this kind of a bounce was a near guarantee, gap or not.

From Friday's Daily Wrap

 "SPY 3 min with a relative positive divegrence suggesting some attempt in to early next week to fill the gap from today, possibly more if there's a stronger base built, but the market is in a very dangerous spot right now based on the trend and signals."

I did suspect the market would try to build a little larger lateral base that was more than just the Friday "Flameout lows"...
 Example intraday divergence in QQQ (3min) Friday at the "FlameOut" (Short term seeing capitulation event) lows in the afternoon at the white arrow/positive divegrence.

I had suspected something a bit more like this Friday afternoon coming in to the early part of Monday, a move toward the "Flame-out" lows/support for a small "W" base which would give more support for a gap fill and then to move in to the gap represented by the orange area.

Either way, the result is the same as the overnight Chinese PBOC RRR cut and Chinese stock market regulator comments meant to walk back Friday's comments, eased the losses in Chinese markets and were of help to US futures.

 IWM's flameout area Friday afternoon with accumulation of the stops that were hit. This 1 min intraday chart is in line, which is no surprise for right now as we fill the gap.

You can see the same Friday "Flameout area" divergence and generally in line intraday today for the SPY too, which is what I talked about at the end of the Daily Wrap Friday,

"Overall, the market is at a deep 1-day oversold point so our forward looking analysis for early next week doesn't look so far off, a 1-day oversold bounce and INCREASED VOLATILITY sounds very reasonable here, that should be an excellent entry for positions, options/puts, etc.

However, I think if anything, this week demonstrates just how deteriorated those pilings that support the pier (market) really are, just a bit of impact and you might be surprised how fast and hard they break.

Have a great weekend!"

This is the kind of opportunity I was talking about... From Friday's Daily Wrap

"AAPL wasn't pretty today...

And is now very close to breaking below its triangle's apex, this "should provide some upside next week on an oversold basis and a Crazy Ivan head fake"


AAPL this morning...
And of course this morning.

The general base area is not very strong, it's more of a "V" shaped base of Friday's intraday lows which were a capitulation event occurred on a break of clear intraday support, so it's just looking at assets, following the short term charts, etc.

TICK shows a mediocre move internally, although coming off a very 1-day oversold event, again see Friday's Daily Wrap, although we knew it would be likely a big 1-day oversold event, the Dominant P/V relationship was one of the strongest in over a month, the Sector performance was just decimation, in fact, decimation is 1 of 10, this was more like 9 of 10, even 10 of 10.

TICK is mediocre, you can see the capitulation event Friday to the left in the afternoon and today in the yellow between -500 and about +1000, not really any strong/extreme readings.

The SPX is approaching that same resistance area that I was talking about last week as an ideal head fake area because it is so easily seen in the most watched asset out there.
A break above that trend line/resistance area would set up the best head fake move, based on the concept alone it would be an 80% probability, but there are so many things going on fundamentally that the market can't discount such as China Friday and Greece is looming as they are initiating capital controls today, obviously we've reached the end of the line, so it's hard to say if the market has enough gas to get it done, conceptually I would say it's a slam dunk because of how obvious resistance is and it's the SPX and we're not far off, but after seeing how weak the market has been all year and how many ramping levers need to be engaged just to hold at VWAP, well you've seen it.

There are already signs in leading indicators that we are seeing weakness build in this early in an oversold move (1-day oversold, not like RSI/Stochastics oversold events, these are breadth, much more accurate, much shorter too).

I'll be continuing with the watchlist and monitoring market events, but so far this is exactly (less the double base intraday) what we expected for today. We'll see how much gas there is in the tank and how fast it's burning through it.


A.m. Brief

Good morning, I hope you all had a great weekend and thank you so much for the many kind emails, they mean a lot to us.

Friday's daily wrap ended with,

"Interestingly for next week , especially the early part, Today's Dominant P/V RElationship was SUPER Dominant across the board: 27 Dow stocks, 91 NASDAQ 100, 1141 Russell 2000 and 327 SPX 500, ALL CLOSE DOWN/VOLUME UP.

This is obviously a very bearish relationship, but it's also a strong 1-day oversold relationship and most commonly we see a short term oversold bounce the next day or so.

Of the 9 S&P sectors, ALL NINE WERE RED. Utilities were the best performer at -0.36% and Consumer Discretionary lagged at -1.48%.Of the 238 Morningstar groups, 226 were red.

Only 11 Dow stocks remain above their 50-day moving average, only 1010 (almost half) of the Russell 2000 are above their 50-day.

Overall, the market is at a deep 1-day oversold point so our forward looking analysis for early next week doesn't look so far off, a 1-day oversold bounce and INCREASED VOLATILITY sounds very reasonable here, that should be an excellent entry for positions, options/puts, etc."


So perhaps it is not surprising that futures are starting the week on the front foot.

However, after seeing Chinese futures down as much as 6% on Friday, it sort of feels like the PBOC panicked with the biggest RRR cut since 2008. The PBOC cut the RRR buy 100 basis points to 18.5 %.

As a result the Shanghai composite was only down-1.64% at the Hang Seng down -2.02% rather than some 5 to 6% as futures we're reflecting Friday.

Regulators also came out and tried to minimize some of the impact from decisions and comments on Friday regarding short selling and the actions taken against umbrella trusts,
it truly feels like somebody got a tap on the shoulder!

Still the market is in the deep one day oversold condition and it bounced today makes perfect sense we will see what it is made of shortly as the Greek exit concerns continue to loom.

I'll see you in a bit.