Friday, June 12, 2015

I Didn't Miss Anything

Except 6 vials of blood, does that seem excessive to anyone else?

So since I've been out and come back, the only changes have been more toward the negative such as the Q's losing a good part of their intraday positive divergence and the UIWM seeing an uglier intraday negative divergence, but once again I stress these are intraday charts (steering divergences) and they are fairly small divergences to start with.

 SPY 1 min intraday still in line

SPY 2 min is inline, there's a slight positive since I left and came back in SPY 3 min, but once again the key word is, "Slight".

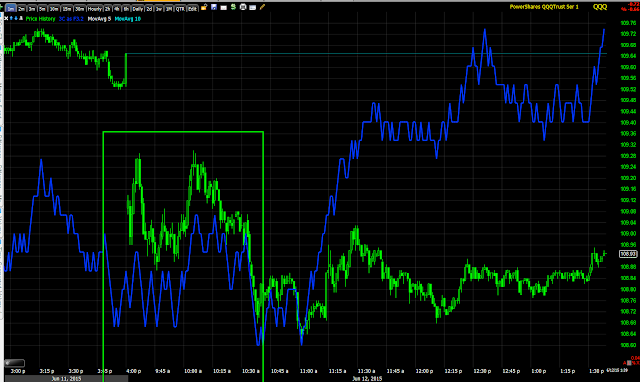
 The QQQ 1 min intraday is still positive, but no move whatsoever.

However the 2 and 3 min charts this divergence migrated to have given it up... QQQ 2 min intraday

QQQ 3 min intraday.

And the IWM
 1 min intraday is showing near perfect confirmation and little reason to believe in much of a move in to the close unless there's a change.

The 2 min chart is looking a bit worse than earlier with a slight leading negative divergence.

 IWM 3 min is showing a sharped negative divergence in to the afternoon.

And while the TICK "seemed " to be improving enough for an afternoon gap fill, it really hasn't done much since I've bee gone.


I'm going to go through as much as I can and get the "Week Ahead " post out. If I do see anything I think looks like a decent/high probability trade set up, I will post it.

Quick Market Update- Out for 30 mins

I need to go get a blood draw done a few minutes away from my house, this apparently is the only time I can get it done today as the doctor is leaving early and the office closing (my after the close appointment up in smoke). I don't imagine it will take more than 30 mins or so.

In any case, it looks like once the max pain options expiration pin is released, normally around 2 pm, there will be an attempt to close this morning's gap, perhaps more intraday, it's not of much concern as the market has been ruthless about filling gaps.

Again the leader pointing to this probability is the QQQ, the SPY and IWM have slight improvements in that direction, but without the QQQ signal I'd never have suspected that the SPY/IWM would make a gap fill move toward the afternoon/close.

Here are some example charts...
 QQQ 1 min leading, there is migration intraday now...

 QQQ 2 min starting to lead.

QQQ 3 min starting to lead.

As for the SPY...
 1 min is pretty much still in line intraday

 As is the next timeframe at 2 min

The IWM actually has a slight negative tone...

 IWM 1 min

 IWM 2 min in line then slightly negative

 As is the IWM 3 min chart.

Perhaps the best evidence though is the NYSE TICK chart...
Note the improvement intraday as the afternoon wears on.

However we can't forget this is intraday and it is common for price to act randomly during the last 2 hours after the pin is released, a gap fill makes sense.

The bigger picture...

 IWM 5 min at a new leading negative low today

QQQ 10 min also hitting a new leading negative low today.

And SPY 10 min also hitting a new leading negative low today.

I'll be back shortly.


Quick Look at Leading Indicators

For a more in depth look at Leading Indicators see, Leading Indicators Not Helpful For the Market's Bulls

Today's charts show why we call them leading indicators, which makes the post above covering the longer term/bigger picture, that much more important.

 This is the intraday HYG vs. SPX (green), HYG is slightly leading intraday, but you must consider where it is in propper perspective...

 HYG pulling the SPX down toward it as it failed to ramp with the market.

 This is VXX-Short term VIX futures in blue vs. the SPX in green. I've inverted the SPX's price so you can see the relative performance between the two which should be very similar.

VXX should be a bit higher on SPX weakness here. However the SPOT VIX below...

 Is right on. I suspect the VXX price action has less to do with any potential attempt to slam the VIX pr anything like that.

 I mentioned the 30 year yield recently has been leading the SPX (green), here it leads to the upside and leads to the downside, again pulling the SPX toward it.

 Commodities are acting the same way this week

And High Yield Credit is doing the same, although it has now made a new lower low for this cycle.

All in all, not good for the market going forward.

Market Update

As mentioned in the last price action looks exactly like an options expiration pin.

There's really not much exciting intraday, however the larger picture continues to deteriorate badly, I expect we'll be lower in to early next week.

 The NYSE TICK intraday is a bit strange looking, it's simply sloppy with little trend which should not be a surprise given market price action intraday

 This is the SPY 1 min trend, hitting a new leading low today.

However on an intraday basis (zoomed in)
 Today, to the right of the red box, is near perfectly in line.

 The 2 min SPY trend also has hit a new leading negative low today and intraday...

 it too is perfectly in line.

It's the QQQ that has an odd signal, but inly 1...

 This is the intraday 1 min chart which was in line perfectly earlier today, but has seen a leading positive divergence.

Before we jump to conclusions though, at the next time frame of 2 mins...

We are not only seeing a new leading negative low on the day like the other averages, but...

intraday, nearly perfectly in line so it doesn't look like the 1 min divergence is worth much.

 The bigger picture charts are deteriorating as well such as this QQQ 10 min which just made a new leading negative low today.

This is the IWM 1 min and just for comparison's sake...

Here's the 1 min intraday nearly perfectly in line in green with a slight negative.

The 2 min chart is about to make a new leading low.

The 5 min chart has.

Make no mistake, these are very ugly charts, these are the kind of charts I don't ignore, they are pointing at severe weakness.

Quick Update

A full follow up will be right behind this post. It looks like the Q's want to bounce a little here intraday, but the divergence does not go beyond the 1 min intraday chart.

Otherwise this looks like a typical options expiration max pain pin.

USO Position Update

Regarding the USO July $20 put position, here is an chart update and the first target I'm looking for.

 USO 1 min is still leading negative

However it's the longer 10 and 15 min charts above and below that I'm most interested in, both are suggesting USO break be;ow it's base's trendily/support now.


15 min USO

My first target on the downside is below $19, inside the base area. If/When we get there, I'll reassess USO and see if it's still worth holding. The equity short in USO will also remain open. I'm hoping for a lower target near the bottom of the range around the $16,50 level ultimately.

Early Indications

Honestly not much has changed since yesterday except for a weaker than expected open.

The charts are still falling apart...
 SPY intraday at a new leading negative low, this should keep moving down the time-line chain.

 SPY 5 min which has been the "gas in the tank" timeframe, also leading negative

 The 10 min charts in all of the major averages surprisingly leading negative sooner than I expected.


As for the SPX daily with a 100-day (yellow) and a 150-day (orange) moving average, I'd like to see a confirmation candle on the close, maybe something similar to what I drew in yellow- representing a dark filled candle opening at the highs and closing near the lows.

 I've spent a fair amount of the morning trying to keep up with Greek headlines, it seems there's quite a bit of fear as the opening TICK print was near -1400.

Did you hear some of the talk coming out of Europe, the EU's Dijsselbloem with an ultimatum, "Non-compliance is not an option", as if the Greek government didn't know what they are facing. It sounds a bit like a veiled threat. 


Germany's Economic Minister says a Greek-exit would be a disaster and then a lot of talk about how it would be difficult for Spain, Ireland and Portugal to do the same-leave the EU because of a strong Euro and this from none other than Chancellor Merkel. The EU isn't worried about losing Greece, they're worried that Greece will set an example that the rest of the periphery will follow, especially Spain.

I hadn't considered this before, but I wonder if this could be enough to set off an armed conflict, after all, what does it matter if the EU is under attack from the inside or out?

In any case, market participants seem very eager to cut lose risk as we have already seen in our Pro-sentiment indicators this week.

 VXX looks a lot like a head fake with a clear area of support and a break below that yesterday.

Today VXX is up about 2+% so far and our recent VXX calls up near +17% today on the day.

 The VXX 5 min leading divergence is pretty impressive and confirms the SPY 5 min leading negative

UVXY's 5 min is even more impressive with confirmation in XIV as well

XIV 5 min-the divergences go well beyond 5 min, but these are largely longer term signals that have been in place.

Interestingly, the VIX futures themselves look like this...
Leading positive and on a 30 min chart.

Obviously I don't feel very good about the market's prospects.