Friday, February 17, 2012

The Effects Have Already Started

I suppose the fact the ECB completed their swap today (which came a little out of the blue) and the announcement of retroactive CACS came after the EU close and today is op-ex when Wall Street has a vested interest in pinning the market rather then letting it discount these events, was beyond coincidence, however that doesn't mean the effects aren't being seen...

Here are some Bloomberg Terminal (Maybe next Christmas?) charts of Greek GGB yields...

 This is a new record high for Greek GGB's at 629% and the biggest 1 day jump EVER!

This shows 1 day price moves and today's record breaking move.

Next Week is Shaping Up To Be Historic

Forget March 20th, Greece, may receive the title of the first developed nation in 65 years to default.

Very conveniently, only after the ECB completed their bond swap with Greece today for brand new shiny bonds, which effectively ends the IMF's campaign to get the ECB to take a loss either real or on profits to help bring Greek GDP to a sustainable level (something Draghi said he would not do and has remained true to his word) and only AFTER the European market closed, does this news come out from Bloomberg about the formerly theoretical option of retroactive, Collective Action Clauses meant to force any private sector holdouts to take losses of 50-70%.


Greece Said Prepares Collective Action Clause


"The Greek government is drawing up legislation that could be used to impose losses on investors who don’t support the debt swap that’s part of the country’s new bailout package, said two euro-region officials familiar with the situation."


"The law may be introduced to parliament in Athens in the coming days, said one of the officials, who spoke on condition of anonymity because the deliberations are confidential. Euro region finance ministers are prepared to back the use of so- called collective action clauses if a voluntary debt swap doesn’t draw enough participation, the other person said."


If the new bonds are worth half of par of the former bonds and the ECB has buying them at $.50 on th dollar which is about right, the ECB TAKES NO LOSS and rest assured whatever the details, it will be shown the ECB TOOK NO LOSSES on the swap. The same can't be said for private bond holders, especially if Greece does what it appears set to do, force the losses through retroactive CACS, which is changing the rules of the game in the middle of the game to assure you win.


The problem for Greece and why Greece will almost certainly default next week (and the repercussions of which I will address in a moment), is that the rating's agencies have already made clear what constitutes a default. 


The terms are clear in this WSJ article today:

Could ECB Greek Bond Swap Trigger Ratings Default?


All three major ratings firms in recent months have said that a bond exchange where Greece replaces current outstanding bonds with new bonds that include worse terms for the bond holders would constitute a default.

Depending on the details of the debt swap the ECB just completed, that could be enough to trigger a ratings default in the eyes of the ratings companies.

Here’s what Fitch said last July about a possible Greek bond swap:
An exchange that offers new securities with terms that are worse than the original contractual terms of the existing debt and where the sovereign is subject to financial distress constitutes a default event under Fitch’s ‘Coercive Debt Exchange Criteria.’
In line with the rating approach outlined by the agency on 6 June 2011, Fitch will place the Greek sovereign rating into ‘Restricted Default’ and assign ‘Default’ ratings to the affected Greek government bonds on the date that the offer period for the proposed debt exchange closes.”

S&P and Moody’s have made similar comments in the past as well.

Here's how the ECB could make the swap without losing any gains and still trigger a default...

The ECB won’t book any profits or losses on its bond swap, but that might be enough to be considered default. If, for example, the ECB purchased the bonds at 50 cents on the dollar and the new bonds are now worth what the ECB paid that would mean the new bonds are worth less than the face value of the original bonds. While the ECB would come out without making or losing money, to ratings firms that would be considered a reduction in the value of the bonds and should theoretically trigger a default.
If the ECB debt swap doesn’t trigger a default by Fitch, S&P and Moody’s, the expected private sector bond exchange could easily clinch that distinction for Greece.
Regarding the CACs...
The private sector bond swap aims to cut the value of the bonds currently outstanding by half, which would be a clear loss for bond holders and meet ratings firms criteria for default.
A second avenue for a downgrade to default could come if Greece’s parliament passes legislation introducing a so-called collective-action clause and retroactively applying it to outstanding debt. The clauses say that if a certain portion of bond holders agree to a debt restructuring every single bond outstanding is subject to the same restructuring.
S&P said earlier this month that even retroactively adding that clause whether it is used or not could be enough to consider Greece in default because it is materially changing the terms of the debt.
And how this could effect the market...
In recent week Financial Credit both in the EU and US has been selling off, these are the smart players with the best information so it is likely they knew about what we are just hearing, weeks ago.
Banks have been writing CDS, which in simple terms is insurance against a default. As an insurance agent, I've seen many firms driven either out of Florida or out of business when a payout came due because of a hurricane. I am not trying to insult anyone's intelligence, just trying to break this down very simply. As a writer of an insurance policy, you are betting the probabilities of an event triggering payment are low, as a buyer of insurance, you are betting they are high in the simplest of terms.
All of these financial institutions across the globe, but especially in the EU and US companies via their EU affiliates, have been writing Credit Default Swaps, insurance against a default that now looks virtually certain, this will force massive payouts by the financial firms that wrote the CDS as a way to generate extra income. This certainly cold effect the next LTRO, but that may not come in time to prevent hundreds of companies from losing tons of money, liquidity, bank runs, and who can imagine what else. Perhaps this is why as I mentioned last night, Financials broadly are underperforming and even more so in credit, probably the only players that understand the consequences as equity traders simply watch price and aren't usually very forward looking when it comes to consequences of difficult subject matter. If their 50 bar/200 bar moving average doesn't tell them, they don't know.
So the timing was convenient and early next week, more then a month before the market expects a possible default, Greece may in fact be in default. If Lehman could do what it did to our markets and all of the unexpected consequences, imagine what a nation can do, especially when hundreds of banks are tangled in the mess.


MARKET UPDATE

The SPY/3C is giving nearly an identical signal as it gave last Thursday before Friday's decline, just a bit worse now.


 This is the 5 min 3C chart from last Thursday which started with a relative negative divergence and advanced to a leading negative divergence.

The market fell Friday creating a bearish Harami on heavier volume.


Here;s the same pattern playing out today, except both divergences are deeper and have started much earlier in the day.

The same is true for the other averages...

 Multiple smaller negative divergences have sent the market lower intraday and day to day, but Thursday and today are in the red boxes, the situation is worse now because the leading negative divergence is deeper for all of the averages.

 The IWM

QQQ I just highlighted the declines from the smaller divergences in yellow, but last Thursday-(last week) and today are in the red boxes and again, the leading component is worse now.

I would expect today to be a rather flat day on options expiration unless the large volume of open interest in PUTS was actually bought by Wall Street rather then written, the large volume of open interest puts did strike me as strange given the sentiment indicators being so extremely bullish. This wouldn't be a normal occurrence, but there is a possibility as the high sentiment readings would produce more retail willing to write puts.

Remember both the bond and stock market is closed Monday for President's day.

Bonds in the news

There are two bond stories out today, neither particularly positive. The ECB has swapped their
Greek bonds for the new bonds, no write dwon, no CAC clauses. In essence, the 50 year old concept of eqaul treatment for creditors was just thrown out the window as PSI (Private Sector Involvement) will (if Greece gets the deal don on the terms that have been proposed) will take a 50-70% loss on their swap of old Greek bonds for new ones (depending on the coupon). What happened today is the ECB set a new precedent of two classes of band holders, senior and subordinated and with that, the concept of equal treatment of creditors went the window. What may end up being the unintended consequence and come back around to bite the ECB is the fact that this was what bond holders were afraid of. Now any private bond holders (and we're not talking about grandpa and grandma, we're talking about hedge funds, banks, sovereign wealth funds, etc) know that the more bonds the ECB hold of any one of the PIIGS, the bigger their losses will be when Portugal renegotiates their debt, followed by Italy and Spain. This will almost certainly cause bond buyers to think twice about buying bonds that they now know they are likely to take huge losses on, which will leave the ECB as the only incremental buyer of debt in the Euro-zone and they may have trouble doing that on new issues unless the buyers receive explicit guarantees that the ECB will in effect conduct QE 2 and promise to buy the bonds from the private sector as the ECB can only mop up what is out there on the secondary markets, they can't buy new issuance just as the F_E_D is prohibited from buying at Treasury auctions.

The second scandal in the bond market today is that of US fake bonds, $6 trillion dollars worth exactly which were seized in Zurich, as Bloomberg noted, that is almost 1/2 of US public debt! It gets weirder, the bonds were dated 1934 with a value of $1 billion each. And stranger, the people arrested in the operation were said to have plans to buy Nigerian Plutonium with them. From the Bloomberg article: 
 "The fraud posed “severe threats” to international financial stability, the prosecutors said in the statement."


As the story unfolds, it gets even stranger!


From the BBC we get these pictures of the seized bonds:


This certainly isn't the first time US bonds have been faked, it is by far the largest, the article says the Secret Service gets about 100 cases a year. However, for the keen eye, the question floating around the blogosphere for a story that hasn't really been picked up by the major media, is why would someone go through the extra trouble of faking the "Mother Box" clearly marked as "Property of the Chicago Federal Reserve System"?

URRE Update (long trade)

As I was writing the last post, I had an alert pop for URRE, the last update was yesterday as URRE continues to look better ever since we noticed the early changes in character before it started moving up.

 Yesterday I went through the details of the descending wedge and the new rules that you won't find in a technical analysis textbook, you can check yesterday's update for those details, just suffice it to say, we saw the false breakout at the yellow arrow and then the base in the white box, URRE is doing what it should be doing.

 Yesterday I pointed out this bullish ascending triangle consolidation and volume surging, today we may get a breakout or it may come next week, but URRE is on the right track. Also note the rounding bottom (see the moving average), this is exactly what we wanted to see even before we saw it taking shape. The trendline around $1.50 should be the stage 2 breakout to the mark up phase in which the stock trends better, it's also the easy money stage and where about 80% of the gains can be captured as the bottom 10% (base) and top 10% (top) are the areas of increased volatility and choppiness, so if you haven't looked at URRE as a long, there's still plenty of profit potential, you didn't miss the bus.


 ATR has increased by 20% just in the last couple of week and in side a consolidation! The Trend Channel stop is around $.90 but for the potential this trade has, I wouldn't mind having an even wider stop.

 Short term, there was accumulation yesterday from 1 p.m. through the close

 You can see it on the 5 min chart as well, but what is nice about all of these charts is that 3C is moving with price, which is confirmation.

 You can see it here too on the 30 min

And on the 60 min.

The long term daily chart is what shows the real potential for URRE...
That's a strong daily divergence and a nice size base that should support a nice trend up. Although the initial target it $3.50, I wouldn't be surprised if this was a 500-600% mover.

Patience with this trade has paid off and I think continued patience will pa off even bigger in the future, it's one of the few long trades that shows real long term potential for a nice trend.

VIX Chart Request...

We have a member trading VIX calls and made 40% on his last trade thus week. VIX has since pulled back, so we're looking for an entry...

This the VIX itself, whcih as I've shown several times has one of the most powerful leading positive divergences it has seen in years, remember that this is positive for the VIX and the VIX trades inversely to the market. However we can't get intraday 3C readings on the VIX, but we can on the intraday VXX.

The VIX has formed a bullish descending wedge that has broken out fro the Apex, the rules about wedges in the VIX aren't the same as equities as it is not an equity, but a volatility indicator commonly known as the Fear Index. Low readings show market complacency and are often seen at tops, high readings show fear and are often seen at bottoms, the VIX starting to turn up usually accompanies a market starting to turn down.

 Here's the VXX pulling back to it's moving average that has held well (between 8 and 10 days), also note the large increase in volume as it has rounded up.

 The Trend Channel held the VXX move down perfectly and was only stopped out at the white arrow, the current long stop for the VXX on the Trend Channel is $25.25 on a closing basis.

 Here;s the pullback over the last few days in the VXX/VIX, you can see the 3C negative divergence at the top on this 2 min chart (perfect for pullbacks) and as of yesterday, accumulation started in to the pullback. We want to see that increase and have...

The 5 min chart shows the same pullback and the same accumulation in to yesterday afternoon, it's made a huge leap today to a leading positive divergence on a 5 min chart and very early in the day for such a move.

Even if you are not interested in trading volatility, this has implications for broader market analysis.

QCOR / GALE Update

QCOR was a trade idea from Feb 2nd (short) , yesterday QCOR saw a 4+% decline on pretty good volume. If you like the trade idea, there's still time as the target is $20 and you might even get a little better entry.

The original gap/support I was looking for to be hit has been since the idea first came up.

At the white arrows we see areas of either candlestick hammers , doji's or long lower wicks (short term reversal candles) all on volume. Whenever you see a reversal candle on heavier then normal volume, you usually get a little bounce and since we want to short in to strength, yesterday's 4+% decline on volume, leaving a long lower wick opens the possibility of a little bounce, giving you a better risk:reward entry.

The big picture in QCOR is very bearish...
The typical volatility associated with tops, plus it has already formed and completed a rounding top and is below support.

Here's our target area, although these often are overshot to the downside.
$20 at the long term trend line.

Keep this on your watchlist, any strength in price is an opportunity to add or initiate a position at lower risk, the probabilities are already high.

GALE was an associated pair trade on Feb 2nd with both stocks in the same industry group, QCOR short/GALE long. GALE should be treated as a more speculative trade because of price and liquidity, but it can make up for that in its ability to move fast, however it probably won't last as long as QCOR. It too is offering a decent looking entry now long.

 After the last run and pullback, yesterday formed a star reversal candle on increasing volume.

 It pulled back right to the 22 day moving average where we'd expect and all 3 X-over indications are still showing this as a long.

If you can see the blue Trend Channel, it's quite close as a natural stop so the entry is lower risk right now, with a stop on a closing basis of $.86. Note the ATR in GALE has doubled as it has made its move higher, a bullish signal. If it is going to make the next leg higher, this is about as good of an entry as you'll get.

Market Close

It's been a long night, I just got in an hour or so ago and have been looking at the market. I have mentioned this week that European and US financials' credit has been underperforming the equities themselves and I saw this chart and immediately though, "This looks very familiar"

This shows US Financial stocks more or less range bound since early February, yet their Credit has been selling off hard since the 8th / 9th of February. It didn't take long to figure out why this chart looked so familiar, it was actually instant. You may wonder,"Why doe credit matter, we trade stocks?" The answer is because credit leads equities, it's one of the few leading indicators available and one that the majority of retail traders never bother to look at.

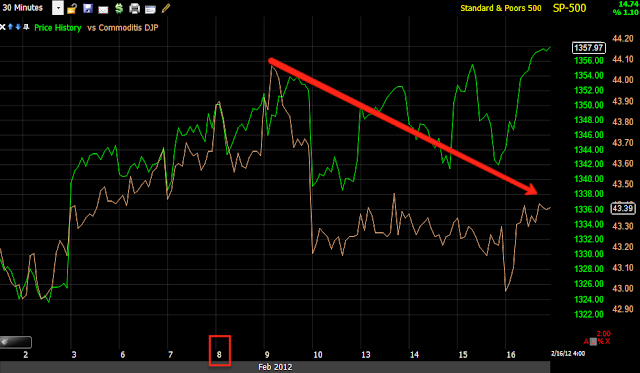
The reason it looks so familiar is that it is exactly what I showed you earlier today. We've been looking at the short term intraday Credit/Risk Asset indicators and the long term, but today I posted the intermediate term of the last week or so, around the same timeframe as the Financial Credit chart above.

 Commodities as a risk asset have been selling off, they are much much further dislocated in the long term then this chart shows, but over the same period of time, there has been deleveraging in the commodity complex, the 8th is used as a reference point as that is about where we see financial credit selling off badly.

 High Yield Credit hasn't made a higher high with the market since the 3rd and has also been selling off since, so not only financial Credit, but High Yield as well.

 The Euro also has been selling off relative to the market over the same time period and despite today's very parabolic move, which I think is purely technical in nature based on the break of the important $1.30 level, the Euro remains in a downtrend on the week. We see it over and over again - a shakeout move after important support is broken. The Euro did this over a longer timeframe the first time $1.30 was broken and before it even bottomed, I said to expect a shake out move and then a move back below $1.30 and then to a new low, all of that happened ad this was before the Euro even hit bottom (for all anyone knew, it could have kept going), I said that at the time because we see this over and over again in every asset class.

The green arrow is Sunday's FX market open when the Euro gapped up, since then it has made lower high and lower lows, even with today's parabolic move (which almost always end bad), the downtrend is intact, but pay attention to the volatility right before the Euro broke $1.30 at the red trendline and then today's shakeout move, which still leaves this week's downtrend intact.

 High Yield Corporate Credit in general (not just financial) has also failed to make a higher high since late January and has been divergent with the market in selling off, again, de-leveraging in the credit markets.

And financials in general have underperformed on a momentum basis a little longer then the financial credit sell-off, that's why that first chart looked so familiar. This is not an exercise of futility or curiosity, it is a leading indicator for equities; a bright red warning flag.

As for today's move, why some financial commentary attributes it to good economic data, it's hard to argue with this correlation and considering why the Euro bounced, I doubt very much this move had anything to do with economic data that wasn't all that important compared to more important data we have recently seen that hasn't produced a similar move. Options expiration tomorrow also can't be ignored.


This is the Euro today in orange vs. the SPX, the correlation is very similar. If the short term correlation is intact, there's no reason to believe that equities won't revert to the mean of the long term indications of a much lower Euro.

As for Price / Volume relationships for today, there was only one index that had a dominant P/V relationship, the Dow...

The relationship was extremely dominant at Close Up and Volume Down which is the most bearish of the 4 possible relationships, it was nearly 3:1 over the second place relationship.

Several days ago I noticed the Rate of Change in the SKEW was increasing again and started posting it nightly, tonight it's made another new high in this leg, as a reminder, the higher the CBOE's SKEW, the more probable an improbable event will occur, it might be called the "Black Swan Indicator" as higher levels indicate an increased probability of a market crash or Black Swan; it's an interesting indicator.

As for op-ex tomorrow, I took a quick look at the Call/Put open interest...

This is the Call chain for the SPY, note the open interest around in the money Calls...

Now look at the open interest in the Puts...
About 90% of options expire worthless, smart money tends to write them and pin them. A quick look at the open interest shows they'd have a lot more to lose if the market went down further today and into op-ex as the in the money Puts have very low open interest, but below that the open interest in much bigger then that of the calls so in pinning the most options, a decline in the market would certainly not be in their best interest.

The closing volume was interesting as well.

 Volume was huge at the end of the day, but in to flat to slightly declining price action

It's not that hard to see momentum started to fade in the early afternoon, the ATR dropped nearly in half from the open to the close on a 15 min timeframe, meaning the range of each 15 min candle dropped significantly.

I was asked about Dr. Copper in n email tonight and some specific copper stocks so I took a look (It's called Dr. Copper because copper has been another traditional leading indicator for the market).
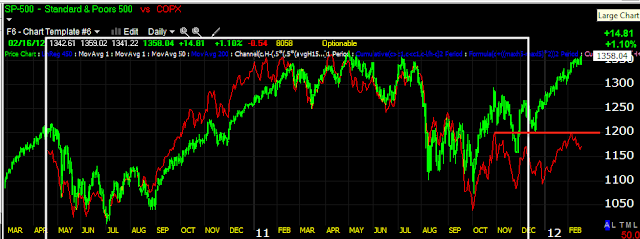
 This is the long term copper index in red vs the SPX...

Look a little closer though and Copper is below it's August high, it's not leading the market, it's not even in line with the market. I looked at another measure, COPX.

Notice that COPX is divergent with the market and hasn't made a new high since October, this is the FIRST time since COPX was created that it has been divergent with the market. I'll cover the stocks in more detail tomorrow.

I mentioned this earlier in the week when talking about Dow Theory,
Dow Industrials vs the Dow Transports are diverging as well. While the Other major indices aren't diverging in this same manner, there is certainly a relative divergence between the NASDAQ primarily and the Russell 2000, Dow-30 and to a lesser degree the S&P-500. Again, Dow Theory is another leading indicator.

Skimming through the Dow Industrials, I was surprised at how many are just plain flat, but considering these are the blue chip, I was even more surprised to see how many look just plain bad, both on a relative basis compared to the Dow and on an individual basis.

 AA

 CVX

 DE

 JOY

 KO

 MCD

 PFE

 PG

 T

 TRV

 VZ

XOM

Of course, only two of these are in the top 5 weighted Dow components and only 3 of them have a weight of 5-6%. If you want to move an index, you only need buy the top weighted stocks, but that's a breadth conversation that's a bit longer then I want to get in to tonight, suffice it to say, 22 of the 30 are underperforming notably the Dow itself, 2 are outperforming and the rest are in line, you could probably guess those that are outperforming or are in line are among the most heavily weighted components.

I won't bore you with all the charts, but XLF is severely underperforming a handful of the major money center banks, so a few of these banks are outperforming while financials as a whole are underperforming badly.

As of right now, bot ES and the EUR/USD are pretty much flat since the close, I suspect a pin tomorrow on op-ex considering the options chain charts above.

As of right now, futures are flat across the board for US averages.

Looking through the news tonight, the one interesting tidbit I dug up is that Germany is no openly talking about Greece leaving the Eurozone, which seemed to be the end game any way, that much has been pretty obvious. The problem however is that they are now talking about withholding their decision on the next tranche of aide until April (apparently after the Greek elections), this would put Greece in default as March 20th is when their debt payments come due, furthermore, there's talk that this will derail the debt negotiations (PSI) as the private creditors would want assurances of Troika involvement before agreeing to any deal.

Here's the story... and a few excerpts


German leaders openly discusss Greece leaving the Eurozone


Despite the latest agreement by Greek leaders with the troika of the IMF,EU,and ECB, the German Finance minister and other high ranking officials are openly discussing Greece leaving the Eurozone.
Now some members of the Eurozone including Germany, Finland and the Netherlands want to push the date for releasing the funds to April. Some Greeks see this as an interefernce into its democracy as elections are held in April and the Eurozone want parties that agreed to the bailout to prevail.
The plan to postpone the payment of the 14.5Billion euros will make it less likely that the private bondholders would want to agree to a haircut on its bonds if they are not assured of EU participation.