
The reason it looks so familiar is that it is exactly what I showed you earlier today. We've been looking at the short term intraday Credit/Risk Asset indicators and the long term, but today I posted the intermediate term of the last week or so, around the same timeframe as the Financial Credit chart above.


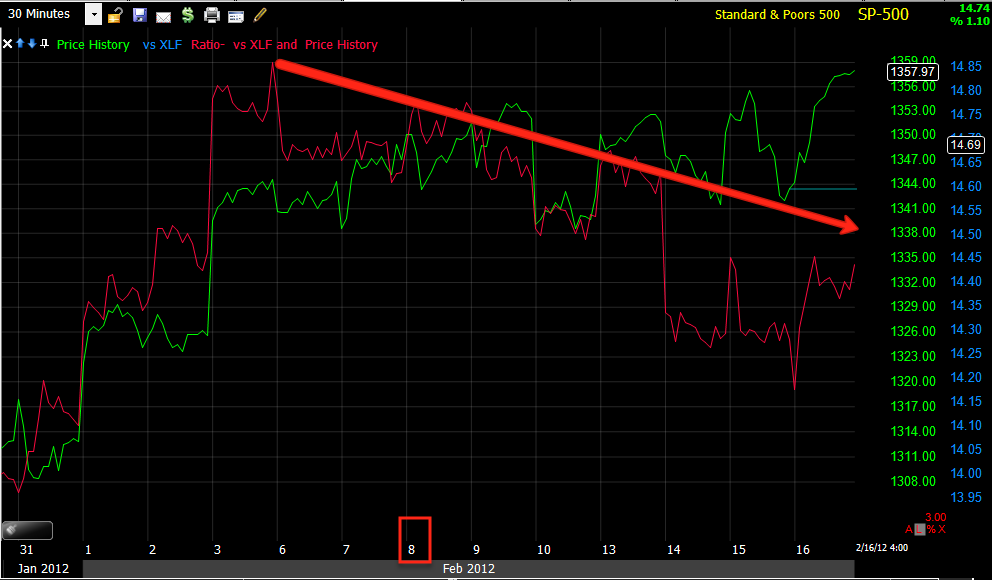
As for today's move, why some financial commentary attributes it to good economic data, it's hard to argue with this correlation and considering why the Euro bounced, I doubt very much this move had anything to do with economic data that wasn't all that important compared to more important data we have recently seen that hasn't produced a similar move. Options expiration tomorrow also can't be ignored.

This is the Euro today in orange vs. the SPX, the correlation is very similar. If the short term correlation is intact, there's no reason to believe that equities won't revert to the mean of the long term indications of a much lower Euro.
As for Price / Volume relationships for today, there was only one index that had a dominant P/V relationship, the Dow...

The relationship was extremely dominant at Close Up and Volume Down which is the most bearish of the 4 possible relationships, it was nearly 3:1 over the second place relationship.
As for op-ex tomorrow, I took a quick look at the Call/Put open interest...
This is the Call chain for the SPY, note the open interest around in the money Calls...
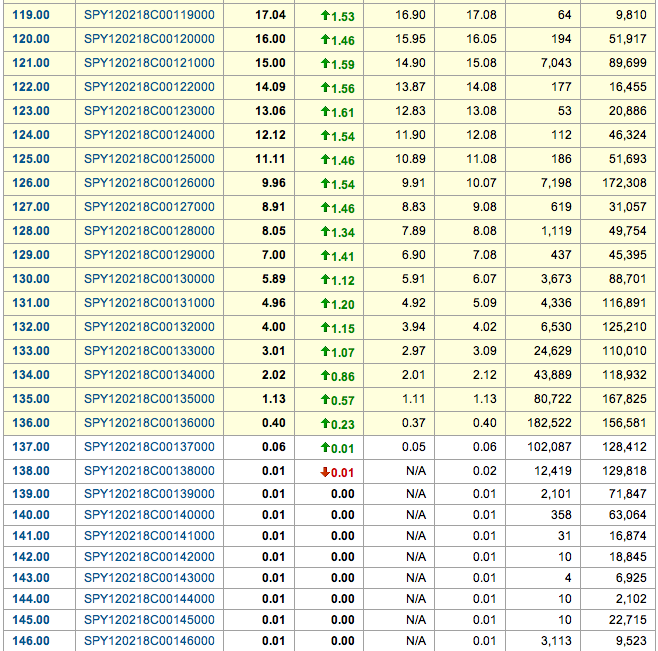
Now look at the open interest in the Puts...

The closing volume was interesting as well.


I was asked about Dr. Copper in n email tonight and some specific copper stocks so I took a look (It's called Dr. Copper because copper has been another traditional leading indicator for the market).


Notice that COPX is divergent with the market and hasn't made a new high since October, this is the FIRST time since COPX was created that it has been divergent with the market. I'll cover the stocks in more detail tomorrow.
I mentioned this earlier in the week when talking about Dow Theory,
Skimming through the Dow Industrials, I was surprised at how many are just plain flat, but considering these are the blue chip, I was even more surprised to see how many look just plain bad, both on a relative basis compared to the Dow and on an individual basis.


Of course, only two of these are in the top 5 weighted Dow components and only 3 of them have a weight of 5-6%. If you want to move an index, you only need buy the top weighted stocks, but that's a breadth conversation that's a bit longer then I want to get in to tonight, suffice it to say, 22 of the 30 are underperforming notably the Dow itself, 2 are outperforming and the rest are in line, you could probably guess those that are outperforming or are in line are among the most heavily weighted components.
I won't bore you with all the charts, but XLF is severely underperforming a handful of the major money center banks, so a few of these banks are outperforming while financials as a whole are underperforming badly.
As of right now, bot ES and the EUR/USD are pretty much flat since the close, I suspect a pin tomorrow on op-ex considering the options chain charts above.
As of right now, futures are flat across the board for US averages.
Looking through the news tonight, the one interesting tidbit I dug up is that Germany is no openly talking about Greece leaving the Eurozone, which seemed to be the end game any way, that much has been pretty obvious. The problem however is that they are now talking about withholding their decision on the next tranche of aide until April (apparently after the Greek elections), this would put Greece in default as March 20th is when their debt payments come due, furthermore, there's talk that this will derail the debt negotiations (PSI) as the private creditors would want assurances of Troika involvement before agreeing to any deal.
Here's the story... and a few excerpts
German leaders openly discusss Greece leaving the Eurozone
Despite the latest agreement by Greek leaders with the troika of the IMF,EU,and ECB, the German Finance minister and other high ranking officials are openly discussing Greece leaving the Eurozone.
Now some members of the Eurozone including Germany, Finland and the Netherlands want to push the date for releasing the funds to April. Some Greeks see this as an interefernce into its democracy as elections are held in April and the Eurozone want parties that agreed to the bailout to prevail.
The plan to postpone the payment of the 14.5Billion euros will make it less likely that the private bondholders would want to agree to a haircut on its bonds if they are not assured of EU participation.


No comments:
Post a Comment