Wednesday, January 9, 2013

HLF Follow Up

I knew something was fishy with HLF and the big guys coming out and admitting to a large short position, one which I showed you was likely covered right at the bottom.

It turns out our flash smash was do to none other than Hedge Fund magnet (because all the others follow him) Dan Loeb's Third Point Fund filing ownership of 8.24% of HLF. This is really incredible, the institutional shorts admit to a large position, it seems someone either covered and/or bought at the lows and it drives HLF up, all the while Loeb is making money on HLF. This is the kind of deception and games that really aren't illegal, but are played at our expense every day. This is why I wait for strong signals and don't just guess.

I'll follow up on this later, for now, I'm not interested in HLF anymore.

HLF Flash Smash

Monday I updated HLF and it's been a fishy story with this stock, I have suspected that it's been being set up for a fall as some strange events have occurred.

In this post on Monday on an update I said there were a couple of things I was watching for, 1) the longer term 15 min chart and more importantly 2) the range that has been created in HLF. In fact this is the very chart from that post...


Here's what happened this morning in HLF...
 A +9.7% move in 1 minute, actually in less time than that, I believe it was 5 seconds, that's what you call an HFT Flash Smash. So the stock that was fishy going in to this has a very fishy move this morning, I still want to be careful with this.

 All of the charts show distribution in to the move, the 1 min.

 The 2 min

 The 5 min

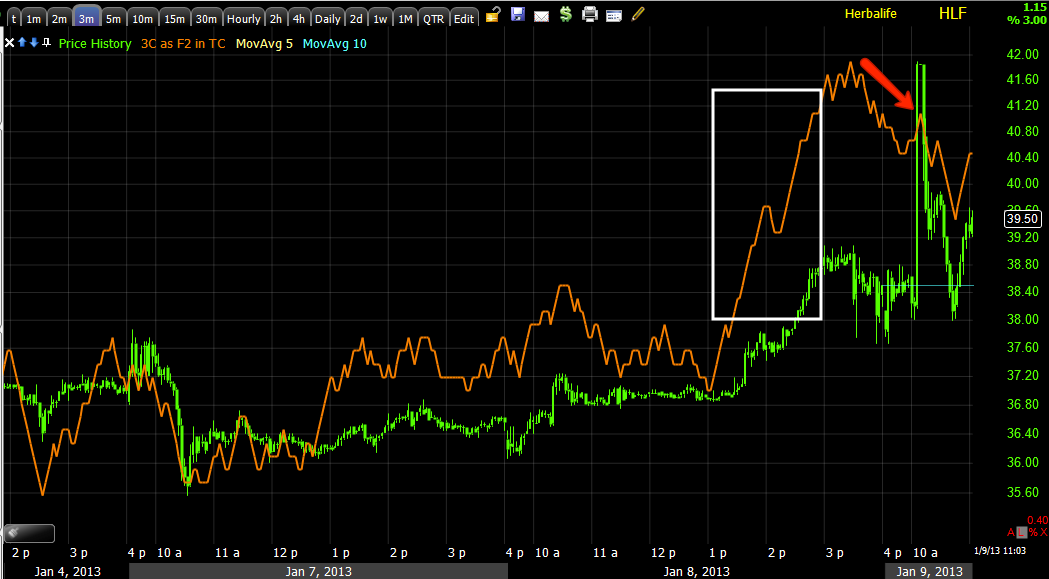
 The 3 min (this should have loaded before the 5 min). The point is there's migration of a negative divergence through several timeframes and all pretty quickly.

From Monday's update the other thing I wanted to see other than what we just saw is this 15 min chart really breaking down harder to a stronger leading negative divergence. It takes a little more time than what has passed since that smash higher for a 15 min chart to move so I'll probably be patient and see if it makes a new low like the orange arrow I drew in, at that point HLF will be a very serious contender for me.

FB Update

If you are looking at FB this morning and like the price action, I'd just sat, "Be careful". For those who might want to short FB or add to (I'm not quite ready to add to until the broader market is in line as well), then FB is worth keeping on the radar as a break back below what is now support would be dangerous for FB.

We have made a good chunk of $$$ in FB long while everyone else hated it and I still like FB longer term, it's the more immediate trade that I'm concerned about and I also am a little concerned that we may be biased because we were making money long on FB when it was the most hated stock, it's easy to like a stock like that, but you really need to be objective and not fall in love with stocks or become partial to them based on past experiences.

Here's FB this morning and why I say, "Be careful"...

a Nice break above recent resistance, but...

 The 1 min chart is in a strong leading negative divergence, it would seem this move is being sold in to pretty hard so far.

 The 2 min chart also leading negative.

 And the 5 min is in leading negative position, but yesterday during the flat range area (the dull trade I warn about), there seems to have been a positive divergence to effect this move this morning, I'm guessing this will fail and turn out to be a head fake move.

As I said before, I'd prefer to add to FB short on a broader market break down with some FB correlation, but I may change my mind on that depending on how things develop.

 There was some interesting trade in HLF this morning as well, I'll likely cover that one next.


Opening Indications

It's the little things, it really is. It's been said many times, "To make money you have to see what the crowd missed" and as I have talked about recently, those things are often the little things, small changes in volume, candlesticks (although those are more mainstream) and yesterday one of the give-aways for short term trade was the Dominant Price/Volume Relationship. I don't think anyone would call this market oversold and the index/volume relationship did not show the same thing as the components of the major averages' Dominant Price/Volume relationship which I posted yesterday as being Price Down/Volume Up- of the 4 possible relationships, this one accounted for nearly half of each average's components. As mentioned, this is taken as a short term oversold condition, like mini-capitulation.

In any case, here's what the opening indications look like so far...

 We are now moving toward the area I'd like to see price break above, this is where we should see some real action, some good signals and high probability trades rather than what we have seen the last few days.


 ES 1 min is not quite confirming this morning, but is making a new high for the week right now.

 The DIA positive divergence was also another signal, it's close to confirming and may do so, but not quite there.

 The IWM longer term chart as mentioned yesterday, a lot of the 5 min charts strengthened yesterday suggesting the averages are more likely to move to that area from Friday.

 This morning however the IWM is one of the poor performers in that it is not confirming yet, I believe there's a good reason for this as you'll see.

 The QQQ is also not confirming this morning as 3C should be in the same area as price.

 The SPY is moving toward confirmation, but not quite there.

Here's where I see some early trouble and it may pass, it likely will pass, but the TICK data is showing some weakness.

For a new high on the week in ES, I'd expect the TICK to be hitting +1250 to +1500, it's barely broken +1000 and it is also diverging to the downside away from the price trend so I'd expect an early pullback unless the TICK data can get its act together and we get more stocks advancing and keeping pace with the market.

It's very early so I'm not concerned right now, we are headed in the right direction, we'll just keep an eye on everything.

Pre-Market Futures

If you slept through the overnight session, which I hope you did, you didn't miss a thing.

 NQ overnight and pre-market showing a slightly bullish 3C bias.


 ES overnight and pre-market not showing much of a bias.

 EUR/USD for the week, barely any movement

Overnight a little downdraft.

The only thing I see sticking out is a short term oversold with last night's price/volume relationship.

Earnings last night were as expected, there will be a focus on that, but I have a feeling before the US comes back in focus the market will start worrying about the EU again, maybe within the next week.

Tuesday, January 8, 2013

The Case For Trend 2

We have talked a lot about trend 1 and how it may end and before trend 1 took off we talked about trend 2, for a while even 3, but I think it was becoming too confusing as this is a rare situation.

First lets just quickly deal with anything I may have left out about today.

In to the close, High Yield Corporate Credit which is right at all time high short interest, sold off a bit in to the close. Yields also failed to follow the market any higher after about 11:30 (off the 11:20 lows). High Yield Credit lost a little ground as well in to the close after showing better relative strength all day.

Commodities which were tracking way below the SPX correlation, then tracking with it, showed early strength today and faded the rest of the day, what is strange about that is they almost tracked perfectly following the $USD lower when they normally have an inverse relationship. There's little doubt the lower dollar in the afternoon contributed to the market's afternoon ramp attempt like yesterday (even though both days have closed down-we're still above support for the Trend #1 move).

Finally the last thing is the Dominant Price/Volume relationship for the components of the 4 major averages, in all 4 today the dominant relationship (and it was dominant) was Price Down / Volume Up. There are 4 different relationships, in the context of the price trend right now this is actually a short term bullish relationship suggesting a sort of short term capitulation. Remember this is not the price volume relationship for the index, it is for all component stocks within each of the averages.

I still think it's likely that we make a move above the intraday highs of this past Friday which is very fertile ground for a real downside reversal as we are creating more and more of a range every day we trade like this, it becomes much more obvious where stops will be placed, where limit orders will be placed, Technical traders are just too predictable in that way, plus anyone with TotalView can see it, the market makers, specialists and other Wall Street types have a much more in depth view of the complete book, this is why I never place an order until I place an order, you wouldn't show me your hand if we were playing poker would you?

As for the case for Trend #2, I've pretty much laid it out and there's probably a little bit of it in each post throughout the day, such as Financials not looking very good, etc.

As for real hard, objective evidence, there was a cycle that started November 16th, that's what we have moved up from, those lows that were accumulated so it was a planned cycle ahead of time. Now we are on the other side of that process, if you wanted to stage it, I'd say stage 3 (Top/Distribution) which is also the most volatile stage, stage 4 is next, that's decline.

Here are a few charts that argue for Trend #2 which is a move to the downside, I expect at least a new low below the 11/16/12 low to be made, but as always the market tends to be more volatile and extreme than we expect so something even worse wouldn't surprise me.

As of now, here are a few of the charts that are calling for the next move to be down, not only down, but larger and more intense.

I'm not going to go in any particular order.

First the averages from the 11/16 cycle low/start...These are mostly 15 min charts, they are a strong timeframe and a decently long trend.

 DIA accumulation in to the 11/16 low, distribution in to mid-Dec. and our current move (Trend #1) with a deep leading negative divergence and no attempt to even move toward confirmation.

 SPY 15 min with the same, a current leading negative divergence suggesting trend 1 was used to create demand and higher prices to sell in to or short in to by those who need a lot of demand to move their positions, this is partly why this move was predicted and it dovetails almost perfectly (head fake) in to trend 2.

 QQQ 15 min w/ accumulation going in to the 11/16 low, distribution by mid-Dec. and a leading negative divergence at trend #1.

The Futures charts are a bit more damning I think, especially the ES (SPX).

 This is a 60 min NQ (NASDAQ Futures) leading negative on the move up.

And a 30 min ES (s&P Futures) with a VERY clear leading negative trend. I always warn about ranges like this, even if they are only intraday, people get bored, lose their focus. I have an analogy for these ranges, "Their like the kids in the room next door being a little too quiet". You assume not much is going on, this 30 min chart of underlying action shows you there's a lot going on.


 Treasuries at 15 min with a leading positive divergence, this is the flight to safety trade so it wouldn't surprise me if the negative divergence or money flowing from ES is flowing right in to Treasuries which tend to move opposite the market.

 The VIX has certainly seen some odd times due to hedging the Fiscal Cliff and now the Debt Ceiling, but the daily 3C chart has always worked well, the positive divergence in 2011 created a 20% drop in the SPX.

 The 3C daily divergence (leading positive) in the VIX right now is about as strong as it has ever been, this suggests a strong VIX move up, the VIX also trades opposite the market and has seen historic volatility over the last 2 weeks or so.

 Look at the trend in the 2 hour VXX (Short term VIX Futures), 3C moved with price because they are short term, but this leading positive divergence seems like someone is even building a large position here , expecting volatility to shoot through the roof and the market to drop like a rock.

Even the leveraged UVXY has a large change in character and this on a daily chart, it's not very often a short term instrument like this sees a daily leading positive divergence. Someone is planning ahead.

 The last time Commodities diverged with the SPX (green) you can see what happened to the market, look at the size of this divergence currently.

 This is commodities vs the Euro, usually they track together, that hasn't been the story lately though, I think a large part of it has to do with the end of the year and European banks repatriating Euros to fix their books.


 This unfortunately did not load in proper order, but commodities vs the $USD (green) tack almost the mirror opposite as they should, that's a correct correlation, stocks should be following it too, the fact the Euro fell out of bed with the correlation to the $USD argues for Euro repatriation during December.

 Yields are lie a magnet for Equities, eventually they revert to the mean, the divergence in March to May was our first core short area, look at the size of the divergence now.

 Long term look at the divergence in Yields from the 2000 top to the 2007 top and now the 2013 area, this has EVERYTHING to do with the F_E_D's intervention. Remember, unwinding accommodative policy is the hard and painful part, but it has to be done at some point. This is probably way beyond just trend #2 and more of a secular long term trend.


 The Euro was supportive right before the Market jumped on trend 1, after it jumped the Euro went negative as these are typically closely correlated, I expect before a turn to trend 2 comes, this divergence will be even deeper, it can happen much faster than you might think.

 The $AUD is a great leading currency, it's tied close to several carry trades so when it is negatively divergent, things aren't good behind the scenes. This however isn't a huge divergence, at least not yet, perhaps it will grow.

 The McClellan Oscillator, a lot of people use it different ways, I prefer it as a divergence indicator, it's called some serious bottoms like the October 2011 bottom and some serious tops as you see.

 This is the NASDAQ 100 Advance / Decline line, also negative like the broader Composite.

 This is the broader NASDAQ Composite advance/decline line, note reversion at the October 2011 low we predicted as a new low that would lead a strong move up, the reason? It's a head fake move.


Finally the Russell 2000 Advance./Decline line also has fallen out of bed. It's been a while and while this may not be as connected to trend 2, it tells you something about the state of the market as we have moved forward from 2009, it has become more and more fragile.

Really the SPY, DIA, QQQ, IWM divergences are enough for me, add the futures in and I don't have much trouble calling for a pretty strong move down, but there are a lot of other things. This may not be and I don't expect it to be the final break in the market, unless the F_O_M_C minutes released last week change things significantly, so we still have time for some monster divergences in leading indicators as well as longer timeframes in the market.

We just need to watch for that tactical opportunity that really could pop up at almost any moment, but I think it's much higher probability above the SPY intraday highs of this past Friday.

As for futures right now, both the NASDAQ and SPX futures have 1 min negative divergences in them, that doesn't mean a lot when you consider the entire overnight session, but it's always something I want to watch in case it goes south fast.

Have a great night, see you in a bit.


Interesting Closing Charts

Earlier today I could see this trend developing in the 3C charts, but among the 4 major averages, there wasn't a single one that I could use to demonstrate what I was talking about as each average was at a different place in the process so I used ES (S&P Futures). You could see the 1 min chart which is really just intraday signals most of the time and it was sloppy, not in line with the market, but trying. Then you could see the 5 min chart (1, 2, and 3 min are what I consider to be intraday timeframes, each stronger than the previous- but 5 min is where there's a real difference and we start to see bigger institutional activity. We can see market maker/specialist and probably HFT activity on the intraday charts, but between 3 and 5 min, there's a big difference) which was putting in the first solid positive divergence of the last few days, this hints at a stronger move coming in the near term and as you know I've been looking for a break above Friday's intraday highs, I think that's the most likely area for us to start seeing some really strong signals that are worth acting on and that lead us to the next trend which is worth trading rather than chopping sideways.

However by the close I am able to show you what I saw early in the process now clear in all 4 major averages.

 DIA 1 min had several smaller intraday negative divergences today, but the main theme was confirmation as 3C moved largely to higher highs with price.

 The more important development under the surface is the longer charts that hold more sway, like this 5 min DI chart with a positive relative divergence and then adding a leading positive divergence in to the afternoon. This is what I was seeing hints on, but had no good example until now.

 IWM 1 min was positive at the 11 am lows, but failed to make higher high on the 1 min chart, however there was something bigger going on below the surface, something price can't reveal.


 The IWM 5 min chart in a leading positive divergence just like the DIA.

 The QQQ was negative yesterday afternoon in to higher prices as mentioned last night, I thought it would create some early weakness today as posted yesterday, it did. Even though the Q's put in some decent leading 1 min positives today, the negatives during the afternoon were noticeable. Yet again...

 A 10 min chart with a leading positive divergence nearly all of from today alone.

 SPY 1 min was largely in line with price, the story was on the 5 min chart though...

Another leading positive divergence. This should get us to where we need to be.

I'll be back in a little bit after I check out a lot of other charts.