Wednesday, April 10, 2013

I'd consider UVXY Long For a short term trade

I know it seems I'm taking a bunch of counter trend trades and probably seems just to be "contrarian", but with every one of these it is because of the individual unique signals to the trade and confirmation among other correlated assets.

UVXY is bar far my favorite asset to trade, but I do believe a volatility to move (VIX) to the upside is coming and I'l get the charts out ASAP, but I want you to know what i see ASAP.

While my timeframe is not 1 day or 2 days for most of these, ESPECIALLY with options trades, I try to get as close as possible as I think I can, I have a much higher standard with options trades.

I'll have the charts out soon, it should be noted that VXX (which UVXY is the 2x leveraged version of), is a notable lever used to ramp the market, the accumulation sends a negative signal for the overall market.

AAPL Charts

I actually have liked AAPL and the probabilities looked good for AAPL, but the diffrence between probabilities and High probabilities is all the difference in the world. AAPL's short end charts never caught up to the longer end promise and I still think there's a decent move for AAPL, a real counter trend move, but near term I think the high probability trade is to the downside.

Yesterday you may recall I saw something bullish in AAPL and said I thought it would probably mov higher, but I still didn't want to get caught up in a trade that didn't meet the standards as they can give you nasty surprises.

I chose the longer expiration even though I'm expecting a shorter term move 1) because I don't like Thursday/Friday action near op-ex pins and in case there's something bigger in AAPL.

Here are the AAPL charts.

 Short term is where the issues have been- 1 min

 1 min zoomed out

 2 min at a new leading low in to higher prices

 The 5 min is where I held some hope the shorter charts would come together.

 Here's the 5 min zoomed in

 The longer term 15 min is one of the reasons I have liked AAPL, but I suspect it may make another run lower to form a larger base. Remember it lost over 200 points or about 40%

The weekly chart shows the longer history of APL, compare to MSFT before 2000. The chart shows distribution and considering a 200+ point drop and 40+%, I'd say it did a good job.

Intraday momentum and RSI are also negative as well as the 15 min chart

Opening AAPL Put

Expiration 4/26 and strike $435, I would open a closer strike, but want options just in case this is a bigger move than I anticipate. AAPL charts to follow.

Intraday Head Fake?

As we have all pretty much seen at some point, the market is fractal in nature, things that happen on long charts happen on short charts.

The head fake concept which you can read more about linked at the top right of the site is a move just before a reversal that makes a new high/low or breaks resistance/support or through a pattern, it's job is to get retail  in as smart money gets out and other things as seen in the linked articles.

It's also used for stop runs and other things.

Here's one potential Head fake in the SPY, it will probably be resolved before I finish this post, but it's good to be aware of the concept and how to use it to your advantage.


 Note the TICK (green) moving with the market earlier today and then it starts trending down meaning fewer stocks are closing higher vs their last tick ( 1 min bar), then there's a move above the channel, this can often start new trends, or it can be a head fake move, which comes just before a significant reversal.

 Here's the TICK compared to the SPY in blue, note they move together early on and then the TICK moves down against the SPY's trend, then the move above the channel.

 There's significant volume there, it's not usually smart money accumulating as they rarely do that in to higher prices, it can be part of a head fake move to make it more convincing or can be part of a distribution/churning move -often both at the same time.

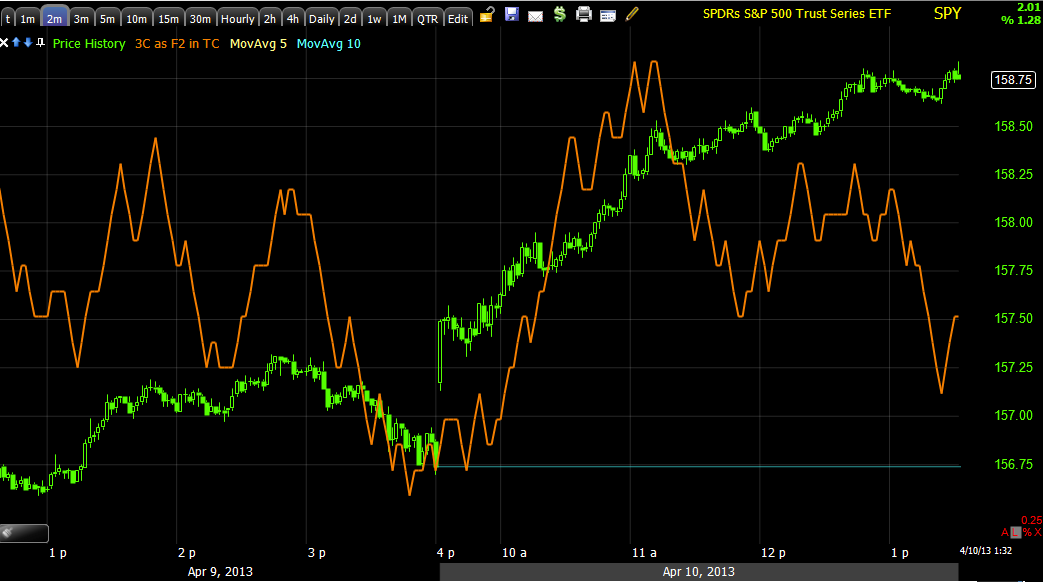
 The SPY 2 min 3C chart

 3 min chart

And more importantly the 1 min chart.

The SPY hasn't answered the question quite yet, but since then intraday volatility has picked up. A lot of people are expecting SPY 160, SPX 1600. This move is just part of the bigger puzzle, but to me it doesn't look good for this time of day. Watch volatility around these areas, it can be heavy.

Quick SPY Update

 SPY 1 min

 1 min intraday

 2 min migration

 3 min migration

5 min migration.

The SPY is losing the momentum indictor, RSI and the VXX correlation which is moving toward fear and showing stronger accumulation (in VXX)

More to come.

Back to the Basics-Market View Through the VIX

Sometimes it's important to take a step back as it is very easy to get "Lost in the lines" and go back to the basics and the bigger picture.

Earlier today when closing IWM calls with an expiration of this Friday and adding to IWM puts with an expiration of next Friday, I mentioned that this was the original thinking for this week, a short term push higher (a strong one as well, it needed to be strong enough to sway sentiment) and that to be followed by a larger move to the downside.

I expressed this all in an example, but not using the market averages, using of all things, the CBOE's VIX which trades roughly the opposite of the market.

The start of this week didn't look anything like I expected it to as algos ramped the market higher on the lowest non-holiday volume day of the year. However after I show you 2 charts, I'll go back to the original post from April 2nd, which I think is still very much on track.

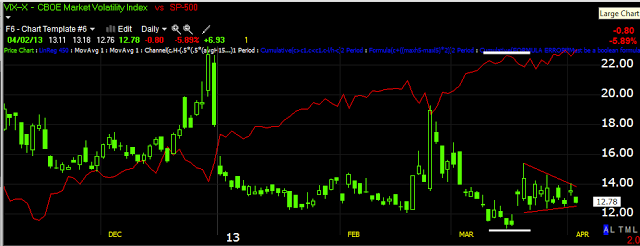
The two new charts are of the VIX since this was the market expectation asset used as an example.

 This is the VIX with Bollinger Band (20/20 setting) and note there are very few Bollinger Band squeezes, this is where volatility goes from wide to very narrow and what usually follows is a very strong, directional move. Being we've already recently hit VIX 6+ year lows, if I had to guess based on this and no other knowledge alone, I'd say the VIX was headed higher (which means the market lower as it shows fear as it moves higher).

At the 3 yellow arrows you can see the only 3 times over the last year plus that the VIX has seen BB pinches, one is right now off a triangle that formed as the SPX was moving up one day and down the next for 14 days in a row.

I'll let the original post lay out the details, but one thing I was looking for was a "False break" or a head fake move and the breakout from the triangle in the first yellow box appeared to be that false break, but since it was to the upside and this would be an important move, I suspected we'd see a "Crazy Ivan" shakeout with another head fake break , but this time below the triangle, yesterday we didn't quite make it, today we are just about there, but there's room in my opinion judging from the VIX chart alone for this head fake move to be more convincing and make a lower move, that could come from VIX futures activity, but it' more likely to come from market price activity, remember the VIX and the market trade opposite so a further low in the VIX would need a further high in the market, which would also help to change sentiment as was expected in the original analysis of up in the market this week, followed by a stronger move down. I should note that VIX futures can also be sold off without the market making much of a significant higher high. Now we would or do have our "Crazy Ivan" shakeout in place, both sides of the triangle were shaken out as would normally be the case with any major move. The major move would be yet to come and larger than the last VIX run, market pullback in February, quite a bit larger.

So here's the VIX post, the original post that it came from is linked at the top too, but I removed the part about the VIX only to save you time. I have not made any modifications to the post, not bold or underlining, no changes at all, it is as appeared April 4th from the original April 2nd post.

Here's the link in case you need it.

--------------------------------------------------------------------------------------------------------------------------------

Thursday, April 4, 2013

Here's the VIX Post

The VIX analysis is part of a much larger post, "Daily Wrap" from Tuesday April 2nd (click the post name for the link) that may be worthwhile reading later to see some of the other assets that were backing up the VIX expectations.

As for the VIX specifically, as there are a lot of subjects covered in the post, I'll show you the specific charts and comments re: the VIX which is not the only analysis by far that suggests this move, but it's in a tidy little package. The following charts and commentary are from Tuesday's post which is linked above (bold text is from the original post, underlined text is added for emphasis in this post).


 "The VIX (green) daily chart vs the SPX (red) shows a squeeze in volatility, this suggests a highly directional move, if past experience is a guide, we should see a head fake move first with the VIX breaking under the triangle and the SPX making a new short term high and then a reversal sending VIX up and SPX down longer term."


"With my DeMark inspired buy/sell indicator, we had a recent buy, then a Bollinger band volatility squeeze of the VIX, a head fake move to the down side and a pop higher that pulled the SPX back and also broke the Trend Channel (stopped out the trend). Now we have the same volatility squeeze building in the VIX again, this time I think we see a much bigger move, which probably means the head fake move down in the VIX and up in the SPX is also much more convincing/stronger."

Back to current analysis, most of you are familiar with the "Crazy Ivan" shakeout concept. Also the manipulation of Technical Analysis and sentiment the last couple of days would certainly draw in shorts, this makes any subsequent move to the upside (even if it is short term and structurally weak) very strong as the "Head Fake" concept is used to full effect, if you are not familiar with the concepts, please check out the articles which are linked at the top right of the member's site and here, Part 1 "How Technical Analysis Went From an Asset to a Trap" and Part 2 "Motivation".

If we simply follow the concepts laid out in these posts, then the move in the VIX the last couple of days really cements the head fake move and creates the effect that moves the market to extremes.
This covers the head fake, the Crazy Ivan Shake out which also catches a lot of traders right now with very strong bearish sentiment, which is part of the "Head Fake" Concept in providing momentum to the reversal. The first BB squeeze led to a directional move, this also would be the same move that I talked about last night as the area which when we look back on a year from now, we'll recognize that area as the place where the back of the trend was truly broken.  The next volatility squeeze produced a big VIX move Wednesday, so far today's follow through is very weak, this appears to be the first half of a "Crazy Ivan shake out, another head fake-momentum producing concept. A move lower in the VIX below the triangle would likely send the SPX to new highs which is part of what is needed in these head fake moves, THEY NEED TO BE CONVINCING TO WORK.

 The 60 min long term VXX shows accumulation before the first run higher and more accumulation now, this ultimately is the direction, volatility up, market down, but before that and because the Head Fake concept creates the extra momentum when it comes to the real downside move...

 The 1 min intraday is already negative and turning the market to the upside, that's failed confirmation for yesterday's VIX move.

The 15 min chart is right in the timeframe that can produce the momentum needed and about the timeframe expected for a move down in the VIX (VXX is the asset here) and up in the market.

This is my theory, it has been my theory for a while. I'm going to check other information to see if it is confirmed or negated.


GLD and SLV Update

Both PM's are cooling their heels a little which I'm glad to see, a 1 day or less pullback doesn't give much time to put together a very solid base, the larger the base (with accumulation) the stronger the move it can support, likewise, the bigger the top (with distribution) the harder the fall.

I expected both SLV and GLD to show accumulation in to the pullback which would lead to a high probability leg higher as the longer charts suggest (there's still plenty of gas left in the tank), I didn't think we'd see it so soon and as strong as it was earlier, now it's dialing back a bit which is good.

Usually Gold and especially silver are my least favorite assets to analyze, but with the signals so strong, they couldn't be ignored.

 GLD intraday 1 min shows the early positive divergence and now it's cooling off a bit before prices rise which should allow it to accumulate more at more favorable prices.

 GLD 3 min (it's the longer 30+ min charts that really show the power in these two assets as seen in the last post), shows the bottom on April 4th which is exactly where we bought and yesterday's distribution and sale at the top, however we can already see a positive divergence building on a longer intraday chart so I think both of these are going to offer a nice pullback position at better prices, low risk and very high probabilities.

 SLV 1 min was very positive earlier, price started rising and it's cooled off, this looks like the work of a specialist, edging back prices as they start to rise so they can continue to fill the order at favorable prices.

 The SLV 3 min chart showing yesterday's clear short term distribution and the reason for closing the 2x leveraged silver long AGQ at a decent profit. Again the positive divergence on the longer intraday chart is already present.

S:V's 5 min chart, also bought on the 4th at the very lows of the move on a sharp positive divergence and sold yesterday, right now today's trend on this chart is in line so we know where to look next for migration of the divergence. I'm honestly glad to see them building stronger and giving a little more time to determine the best way to play them.

Futures Update

 ES / SP-500 futures  1 min


 NQ / NASAQ 100 futures 1 min

TF / Russell 2000 futures 1 min

IWM Call Fill and charts


You might recall the original thesis for this week as of late last week was short term up represented by the weekly calls expiring this week (4/12) and longer term down represented by the Put positions at the monthly 4/210 expiration to which I just added.

The call fill came in at a small loss of 6.8%

Here's some of the current charts for IWM and R2K futures
TF R2K intraday futures.


 IWM 1 min intraday

 IWM 1 min in context

IWM 2 min

 IWM 5 min -Distribution in to the F_E_D leak


 IWM 30 min leading negative since March

IWM 60 min, big picture of the main underlying trend and highest probabilities.

Adding to Yesterday's IWM $92 Put, except going 1 week further out to 4/20

IWM charts to follow, IWM 4/12 92 calls to be closed