Earlier today when closing IWM calls with an expiration of this Friday and adding to IWM puts with an expiration of next Friday, I mentioned that this was the original thinking for this week, a short term push higher (a strong one as well, it needed to be strong enough to sway sentiment) and that to be followed by a larger move to the downside.
I expressed this all in an example, but not using the market averages, using of all things, the CBOE's VIX which trades roughly the opposite of the market.
The start of this week didn't look anything like I expected it to as algos ramped the market higher on the lowest non-holiday volume day of the year. However after I show you 2 charts, I'll go back to the original post from April 2nd, which I think is still very much on track.
The two new charts are of the VIX since this was the market expectation asset used as an example.

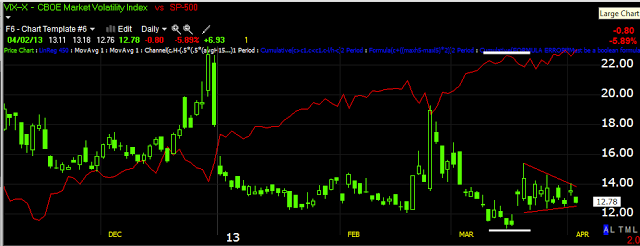
At the 3 yellow arrows you can see the only 3 times over the last year plus that the VIX has seen BB pinches, one is right now off a triangle that formed as the SPX was moving up one day and down the next for 14 days in a row.

So here's the VIX post, the original post that it came from is linked at the top too, but I removed the part about the VIX only to save you time. I have not made any modifications to the post, not bold or underlining, no changes at all, it is as appeared April 4th from the original April 2nd post.
Here's the link in case you need it.
--------------------------------------------------------------------------------------------------------------------------------
Thursday, April 4, 2013
Here's the VIX Post
The VIX analysis is part of a much larger post, "Daily Wrap" from Tuesday April 2nd (click the post name for the link) that may be worthwhile reading later to see some of the other assets that were backing up the VIX expectations.
As for the VIX specifically, as there are a lot of subjects covered in the post, I'll show you the specific charts and comments re: the VIX which is not the only analysis by far that suggests this move, but it's in a tidy little package. The following charts and commentary are from Tuesday's post which is linked above (bold text is from the original post, underlined text is added for emphasis in this post).
 "The VIX (green) daily chart vs the SPX (red) shows a squeeze in volatility, this suggests a highly directional move, if past experience is a guide, we should see a head fake move first with the VIX breaking under the triangle and the SPX making a new short term high and then a reversal sending VIX up and SPX down longer term."

"With my DeMark inspired buy/sell indicator, we had a recent buy, then a Bollinger band volatility squeeze of the VIX, a head fake move to the down side and a pop higher that pulled the SPX back and also broke the Trend Channel (stopped out the trend). Now we have the same volatility squeeze building in the VIX again, this time I think we see a much bigger move, which probably means the head fake move down in the VIX and up in the SPX is also much more convincing/stronger."
Back to current analysis, most of you are familiar with the "Crazy Ivan" shakeout concept. Also the manipulation of Technical Analysis and sentiment the last couple of days would certainly draw in shorts, this makes any subsequent move to the upside (even if it is short term and structurally weak) very strong as the "Head Fake" concept is used to full effect, if you are not familiar with the concepts, please check out the articles which are linked at the top right of the member's site and here, Part 1 "How Technical Analysis Went From an Asset to a Trap" and Part 2 "Motivation".
If we simply follow the concepts laid out in these posts, then the move in the VIX the last couple of days really cements the head fake move and creates the effect that moves the market to extremes.
 This covers the head fake, the Crazy Ivan Shake out which also catches a lot of traders right now with very strong bearish sentiment, which is part of the "Head Fake" Concept in providing momentum to the reversal. The first BB squeeze led to a directional move, this also would be the same move that I talked about last night as the area which when we look back on a year from now, we'll recognize that area as the place where the back of the trend was truly broken. The next volatility squeeze produced a big VIX move Wednesday, so far today's follow through is very weak, this appears to be the first half of a "Crazy Ivan shake out, another head fake-momentum producing concept. A move lower in the VIX below the triangle would likely send the SPX to new highs which is part of what is needed in these head fake moves, THEY NEED TO BE CONVINCING TO WORK.
 The 60 min long term VXX shows accumulation before the first run higher and more accumulation now, this ultimately is the direction, volatility up, market down, but before that and because the Head Fake concept creates the extra momentum when it comes to the real downside move...
 The 1 min intraday is already negative and turning the market to the upside, that's failed confirmation for yesterday's VIX move.
 The 15 min chart is right in the timeframe that can produce the momentum needed and about the timeframe expected for a move down in the VIX (VXX is the asset here) and up in the market.
This is my theory, it has been my theory for a while. I'm going to check other information to see if it is confirmed or negated.
As for the VIX specifically, as there are a lot of subjects covered in the post, I'll show you the specific charts and comments re: the VIX which is not the only analysis by far that suggests this move, but it's in a tidy little package. The following charts and commentary are from Tuesday's post which is linked above (bold text is from the original post, underlined text is added for emphasis in this post).

"With my DeMark inspired buy/sell indicator, we had a recent buy, then a Bollinger band volatility squeeze of the VIX, a head fake move to the down side and a pop higher that pulled the SPX back and also broke the Trend Channel (stopped out the trend). Now we have the same volatility squeeze building in the VIX again, this time I think we see a much bigger move, which probably means the head fake move down in the VIX and up in the SPX is also much more convincing/stronger."
Back to current analysis, most of you are familiar with the "Crazy Ivan" shakeout concept. Also the manipulation of Technical Analysis and sentiment the last couple of days would certainly draw in shorts, this makes any subsequent move to the upside (even if it is short term and structurally weak) very strong as the "Head Fake" concept is used to full effect, if you are not familiar with the concepts, please check out the articles which are linked at the top right of the member's site and here, Part 1 "How Technical Analysis Went From an Asset to a Trap" and Part 2 "Motivation".
If we simply follow the concepts laid out in these posts, then the move in the VIX the last couple of days really cements the head fake move and creates the effect that moves the market to extremes.


This is my theory, it has been my theory for a while. I'm going to check other information to see if it is confirmed or negated.


