Monday, January 27, 2014

Trading Positions

I could close out some trading positions at a gain like SPXU, SQQQ, FAZ, etc. considering what I'm expecting (lateral chop for another day (tomorrow likely as a small base is put together and then a bounce), these positions would see draw down in such a bounce, but I feel I'd rather sit through the drawdown when I look at the big picture and have those positions open rather than not have them open and potentially miss a big move as we are not on the slippery slop, say Tuesday China's PBoC does something whacky that sends the market in to a tizzy, I want that short exposure, but I may enter a few hedging positions, I'm thinking about a gold short since it moves opposite the market.

I'll post that soon, I'm just looking big picture now, I don't think this is the time to try to trim too closely around the fat. VIX positions are different because of their character.

Getting Ready to Close UVXY Trading Position Long

I'm going to watch it carefully and see if I can close it out at a little better price. I don't have strong negative 3C signals to do so, but I don't like the parabolic action and you know what I expect for the market the next couple of days so there's no reason for me to hold UVXY, I will look to add the position back, but for now I see it more as dead money.


GOOG Trade Set up

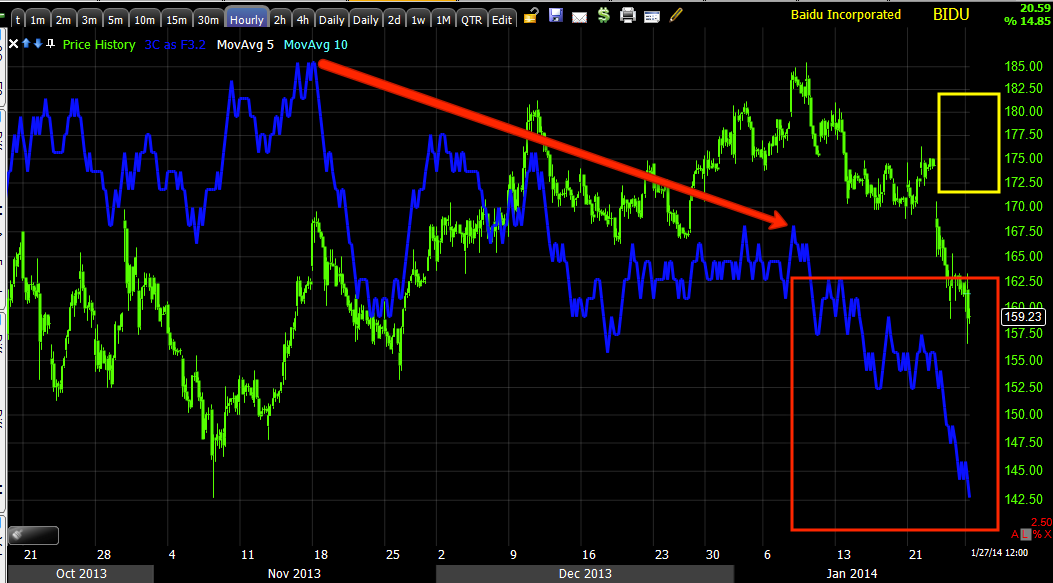
GOOG is interesting, it looks like it needs quite a bit of work to bounce, but maybe not. In any case, any bounce looks to be a golden gift like the broader market, selling/shorting in to price strength, not chasing weakness.

 This is GOOG's daily chart/ 50 day ma

The price action above the trendline/range is what I have been saying for months is a sort of blow-off top, major distribution area.

 You can always get a red flag warning just by watching the changing character of the stock, an accelerated uptrend "seems" bullish, but more often than not, it's a prelude to a top. The small bodied candlesticks and hanging men are a clear sign GOOG ran out of momentum and has formed its own little Channel Buster in which case, the break to the bottom is exactly what should happen after the breakout on the top.

Most times technical traders expect a kiss of the channel goodbye (bounce in to resistance at the channel), however more often than not that bounce will break in to the channel and shakeout the new positions, stops, etc.

 The Trend Channel is set perfectly to hold this last move and it stopped out last Friday. That means volatility is likely, but as far as holding GOOG long even on upside volatility, it's usually a losing proposition once the Trend Channel breaks, if anything you might get a few percent here or there, but have to sit through major volatility and a lot of opportunity cost.

 The 4 hour chart shows the heavy distribution at the range and even stronger above it, this is why I have been saying for months that this area is a sort of blow off or large head fake area, if you consider the entire trend form 2009, the head fake area would actually be quite small.

 60 min chart, look how fast this chart moved nearly straight down, that's a lot of movement for such a long chart, also that means it's a lot of distribution.

Don't only think of distribution as selling, it shows up as short selling as well, both transactions are a sale across the tape.

More to the point, the 30 min chart from confirmation to sharp distribution to a sharp fall.

If you look at price right now, it's hard to imagine a proportionate reversal process, perhaps it just flags or creates a "J" hook, but it should see some reversal process and bounce which makes entering or adding to a GOOG short very attractive on that bounce.

The 5 min chart did an excellent job of calling GOOG as well and it's showing a leading positive divegrence right now so I do think GOOG will behave like the broader market, bounce, sell short in to it and just let those positions keep working as we slide further down the right side of the mountain until the market just breaks.

I suppose I'd be looking for an entry around the $1155 level, although I always want to confirm with 3C, at least you have an idea of where to set price alerts.


BIDU Update

BIDU looks fine, I was temped to close it the same day I opened it with an almost immediate 10% profit in a couple of hours.

In any case, as far as I can see, BIDU is doing what the broad market is doing, putting in a bit of a larger bowl or reversal process which should benefit the calls opened which are merely hitch-hiking trades, then it should offer great position for a short or an add to position.

 1 min accumulation since BIDU's gap down.

5 min leading positive divergence since the same, there's a rounding process/reversal process that is bigger than the broader markets would be so I like this a lot more for a long hitch-hiking trade, I may look in to further positioning as it develops more.

 However, this is the real prize, setting up or adding to short positions, this 15 min was in line on the uptrend and distribution as a top formed, a bounce here would be perfect for new or add to positions (short) BIDU.

The 30 min charts says the same

As does the 60 min, the yellow box is my target area, the gap and above, for the hitch hiking long and I want to close it up in that area and look for the short entry somewhere in that area.

BIDU, the trade that keeps on giving.

UNG / DGAZ UPDATE

Finally, I was very hesitant to let go of the DGAZ long with signals still in place and UNG making such a parabolic move Friday, but on the other hand, that position's draw down got way out of control so I'm glad to see the signals kicking in and DGAZ is up 10-12% today, it may even offer an entry for a new trade (long) on a slight intraday pullback as we don't want to chase a gain like this.

The charts...
 I would have preferred a longer upper wick on Friday's daily candle, but a lot of the churning/volume were in that region where there is exposed wick, not to mention the parabolic move, best viewed on an intraday chart. So far today's candlestick (daily) formation is that of a bearish Harami reversal or as the Japanese call it, "Mother with baby", we call it an inside day.

 DGAZ has the opposite, a bullish Harami or inside day, so I like the looks of that, typically the 3rd day (tomorrow) is the confirmation day and is often a bearish engulfing candle  (for UNG) or a gap up (for DGAZ) those are interchangeable of course.

 This is the distribution in that wick area from Friday I was glad to see.

There was tons of confirmation/migration as you see above on a 2 min chart

And a nasty leading negative on a 3 min chart

DGAZ's 10 min chart (the timeframe that fits the intended trade), held up well, that's why it was so hard to walk away from when there's this huge positive divegrence.

If price pulls back a bit it would make a decent new long in my opinion, as far as an add to, I'd like to, but that would be dollar cost averaging and I try not to do that unless it was part of the risk management before I entered the trade.


 DGAZ needed its short term charts to go positive as the kick start to that 10 min divergence. This is a 3 min from Friday going leading positive and confirming UNG.

This is the stop for this run for UNG, so far the channel held the entire move, even that first area it didn't stop out, right now the stop would be under $23.52, preferably on a closing basis, I think we'll get it and this trade will start to straighten out, thankfully. I'd usually not let a trade get this out of hand, but I also have a very hard time walking away from a solid signal, it seems like weather is changing the next week or so ahead so that should be helpful as well.

Market Update

If you read Friday's post/s and/or last night's, then everything is proceeding along as expected.

 Remember last night I said a lot of the averages didn't have any positive divegrences yet and it would take some sideways/lateral trade to six that, this is the first indication of that in the SPY as it goes positive 1 min (where it always starts) and it should be choppy lateral.

I said the IWM got a little head start, it got whipped the most Friday so it will likely have the widest/choppy lateral range, a real meat grinder to try to trade.

If I'm correct and we did predict this behavior Friday and got evidence of it last night and confirmation this morning, THEN IT SHOULD BE A PRETTY BORING COUPLE OF DAYS OF TRADE ON THE WHOLE, BUT AFTER THAT OPPORTUNITIES SHOULD START PRESENTING THEMSELVES IN BULK.

A.M. Observations

Good morning,

So far, with the exception of the additional news that Emerging Markets are seeing dramatic outflows (RISK OFF) across the world overnight, everything else is as we expected Friday afternoon and especially last night thanks to our friend, the USD/JPY.
The carry pair gains last night as we showed with Yen and $USDX futures. Remember this lifts the market even as EM markets are getting crushed, we've opened within that range I drew last night.

 We have some light intraday distribution, remember NQ futures stayed strong overnight relatively speaking very strong, but we need lateral chop so it will be a series of corrections to keep a range laterally as explained last night.

This is the ES 5 min chart, the positive divergence has built overnight, ES has gained overnight, but remember it's about that sideways , zig-zag range or a "U", "W" over the next couple of days.

 ES 1 min also showing some steering divergences 1 min to send prices lower or halt them a bit, an accumulation zone needs to be formed, that can;'t happen if prices run away to the upside and they can't run away on their own, without the range.

Even gold (above) fell as expected last night and 30 year futures are gaining a bit.

Everything is EXACTLY as imagined Friday, exactly as described right down to my drawing last night.

So far so good. We need to be patient, try to trade a choppy lateral zone is a meat grinder, but there may be some set ups here and there. We want to confirm our theory, get in where it makes sense, be patient and wait for that set up to come to us.

So far, while others are talking about what's happening, we have been predicting it days in advance to prepare so I'm happy.

We do need to confirm that a base is and continues to be built rather than a temporary consolidation.

The Nikkei

I meant to post this chart. You know about the Nikkei 225 down 400 points / -2.60% as mentioned in the last post. It too looks like it will start to get a little footing under it soon, check out the 15 min 3C chart for the NKD.

From perfect downside confirmation to the same leading positive divegrence seen in other risk assets as per my last post.

I'm not saying the NKD isn't going to close ugly, I'm just saying it's likely to join the broad market after and start to look for a toe hold and some lateral/choppy trade the next couple of days.

The Week Ahead

I hope everyone had a great weekend.

As of Friday's last post, I saw the market in this light,

"Looking at leading indicators and others, I'd say they are consistent with what I said before, "If the market can put together a retracement/bounce from oversold (which is relative or subjective), the indicators don't hint at anything more than that possibility, thus the reason I won't go long any market correlated assets for a bounce, I'm saying there would need to be more of a basing process, an unwind of the very bearish action, which is ironic, because Investor .com had the highest bullish sentiment seen by our resident sentiment follower as today began!!!"

Putting aside weekend developments for the moment, from what I see in futures, I think this is still fairly likely, we'd be looking at something along the lines of...

This is what I was saying Friday would be a more lateral trend creating a small reversal process, if other events that have taken place over the weekend don't get worse and turn us toward a 2008 like environment.

The bottom reversals like this are tighter than the preceding top reversals which you see above and quite clearly on a 3C chart of strong distribution in the very same area I pointed out with a USD/JPY vs. ES comparison chart in which the Carry Cross underperformed the market significantly, thus distribution making sense especially as we know for sure BAC's top technical analyst was looking at the same thing last week and revised their bullish stance to neutral.
 This is the area I was talking about in red, the BoFA analyst talking about the carry cross and ES in much broader terms.

What would be interesting (and note my visual representation is just a general trend, not any prediction of the exact shape, volatility or length.

However, it would be pretty close to maturing right around this week's Wednesday F_O_M_C policy statement at 2 p.m. as seen below in red.

Now I think the F_E_D wants out and consensus is for another taper of another $10 bn at this meeting, but there's always the very high probability of a F_O_M_C knee jerk reaction which I ALWAYS warn of, which is usually reversed in a day to a couple of days. The F_E_D could taper, but have a more dovish tone and since expectations are already for a taper, that "could" work out just about on cue for the trend I was envisioning for early this week as you can see from the first paragraph of this post.

In that case, there's not much to do early on, the only way I'd consider trading  an upside bounce/correction is if 3C gave clear signals in a reversal process such as I've drawn.

I don't mean reversal as in go back to a healthy uptrend or anything like that, I simply mean the normal bounces we see in waves, especially after a move down like we've seen last week.

As of Friday I didn't have a whole lot of 3C evidence to go on that supported this theory, tonight I have a little more. In this situation there's an several possible opportunities, but I don't see the need to do much, I'd still leave trading and core shorts in place generally speaking, I "MIGHT" consider a quick bounce trade if the signals were there in a reversal process, but they have to be very strong because I think we'd be trading against a very bearish underlying tone in the market, heck a bearish price trend in the market, especially in carry trades.

Any bounce would be the real opportunity to short in to strength, take my BIDU idea, hitch hike a bounce higher as I opened some calls Friday and then set up core short positions in to the relative price strength (or add to positions and even trading positions), so the real bulk of movement on our part wouldn't come until mid week and that's assuming some early signals suggesting Friday's commentary posted above is correct.

OK, so as far as what I had as of Friday, some weak, but noticeable Leading Indicator signals, a few 3C signals in particular some starting in the IWM, again weak, but tonight while Asian markets are getting hammered, US markets are roughly unchanged from Friday's close. In addition, I have something else far more valuable...
 ES 5 min positive divegrences in to the opening of futures for the new week, now leading positive.

The same for Russell 2000 5 min chart

And Nasdaq 100 futures.

Don't get me wrong, in my view this would just be a start and the process would have to mature, but Wednesday looks like a reasonable maturity date considering the proportionality.

Also notice the build in volume, to me that looks like a short term oversold or washout event. I'd say early in the week we'd see some volatility carry over from last week and then lateral chop which isn't the best trading environment, but we want to see that and confirm the 3C signals, we can make choices whether we want to play some hitch-hiking trades, but the big picture is to still use any price strength to short in to and once again we'd verify distribution in to any bounce or retracement which would be perfectly normal.

The real evidence that say, Use any chance you get to short in to price strength " is the longterm or strongest underlying tone, take the 4 hour Index futures...

 ES relative to deeply leading negative, this damage doesn't get fixed, in fact it likely gets worse in to any price upside which gives us a great edge to short in to strength or to add to shorts in to price strength and I USE THE WORD "STRENGTH" WITHIN A VERY RELATIVE CONTEXT.

However, bear market counter trend rallies tend to be some of the most impressive. While the trend isn't technically a bear market, many other assets that are highly correlated are moving in to a bear market, the carry trades being on of the most significant.

 NDX 100 4 hour leading negative divegrence.

Russell 2000 4 hour leading negative divegrence after significant distribution to the left.

This is still early information, but it fits the opinion I held based on what I saw Friday, in fact it adds some credibility to that opinion.

Except for the IWM, there are no real positive divergences in the averages so they would need that lateral or "U"/ "W" shaped lateral movement too put those divergences together (as mentioned late Friday the IWM got a head start.

One other signal that I noticed, I mentioned Friday that the USD/JPY and EUR/JPY as well as the Yen and $USDX were all traveling lateral while the market was down, this was relative strength in the carry crosses, look what else I found tonight.
 The USD/JPY moving sideways Friday, it opened lower tonight and bounced back up in to the lateral range.

For the USD/JPY to help the market or just maintain its correlation, we'd need to see the Yen come down and the $USDX move up, so this is interesting...
 The 15 min single currency Yen futures with a 15 min leading negative divegrence. This in no way cancels or changes the Yens larger 2014 trend, but it does suggest it pulls back as it has before advancing higher each time this year.

The USDX/$USD would need to move up and guess what we have on the 15 min chart, a leading positive divegrence so we have good early confirmation on the opening of futures for the new week.

In addition I have a gold 15 min negative leading divegrence as gold has been trading opposite the market and I have a 30 year treasury futures leading negative divegrence so I think we have pretty darn good evidence to say Friday's opinion is showing confirmation.

Again, the market would need to do some sideways/choppy lateral work to create that reversal process and I don't see this as anything more than an oversold bounce that will be a gift to short in to, but we would certainly keep an eye on developments, the probabilities though are already heavily skewed as the 4 hour Index futures charts show. Those charts say, "hold shorts during down moves and add to them in any moves up".

So I think we have the makings for some good set ups, maybe some long hitch-hiking trades with calls or leveraged long ETFs as I don't think a regular equity (SPY long) would be worth it, no market longs may be worth the risk, we'll just have to let the market tell us.

As far as the Fundamental news I mentioned, we know about the potential Chinese Trust default that may be coming up this week as well as concern over their mining industry defaulting on their loans. The huge liquidity injection last Tuesday suggested (as the market rallied on the news) that there was big trouble, a liquidity lock up is what caused the Bear Stearns/Lehman era bear.

So in addition to that UK banks seem to be concerned or having their own liquidity problems.  HSBC was apparently giving customers who were making large withdrawals a hard time demanding to know why, since that story broke they cut out the nonsense as that is more likely to cause a bank run, but they are apparently worried about liquidity for some reason.

In addition Lloyds banks (3 subsidiaries included) are having ATMs "out of Cash" and customers having problems using their card to complete transactions with transactions being declined. Lloyds has only said they are working to resolve it, but this doesn't have a very rosy smell to it, essentially 4 IK banks or two large ones are seemingly showing signs of a liquidity crunch, it was bad in the US but if we see a global liquidity crunch/credit market freeze, just imagine what the market would look like, 2008 would look like a stroll in the park!

Things are obviously not looking good in China and elsewhere and timing is very interesting considering the concern over Chinese defaults and Shadow Banking trouble.

In addition, Japan posted the largest annual trade deficit ever! Japanese Credit sank, the Nikkei 225 which is similar to the Dow in size (points/percentage) was down -400 points or about -2.60%, Japanese Yields fell hard as the flight to safety trade commenced in to bonds and as I posted in April 2013 (you can read the articles linked on the member's site under "Currency Crisis" ) as it seemed evident way back then, Abe-enomics and Japan's monster QE that seeks to double the monetary base in 2 years, looks TO BE AN ABSOLUTE FAILURE, THE TRADE DEFICIT IS JUST ANOTHER CONFIRMATION IN A LONG LINE OF THEM AND PERHAPS THIS IS WHY WE HEARD THE IMF TALKING ABOUT JAPAN AND STARTING TO LOOK FOR THE END GAME FOR QE-ZILLA WHICH ISN'T EVEN A YEAR OLD YET.

It seems to me the market is progressing or digressing along the lines of the extreme 3C signals, as we know, we can see the 3C signals and the distribution, we just don't know the back story until later and if you wait for the back story you missed your chance to make money.

So I think we have been positioning ourselves well, I am happy with the way things are progressing, I think there's an opportunity here that likely hasn't been seen in more than a generation for those who understand the market dynamics and figure out the new dynamics and have a real edge, I think that's us and I'll be right there with you as I'm not missing this one, in fact I put off buying a house to be in this market.

PLEASE REMEMBER THAT I HAVE SURGERY TUESDAY AS I HAVE BEEN MENTIONING FOR THE SKIN CANCER UNDER MY EYE, I WILL BE BACK IN FULL SWING WEDNESDAY. However I think Tuesday is probably the best day for this if my theory is correct as the market should still be lateral in a basing process.

I'll see you in a few hours, I have to say, I am excited.


Friday, January 24, 2014

Final Update

Looking at leading indicators and others, I'd say they are consistent with what I said before, "If the market can put together a retracement/bounce from oversold (which is relative or subjective), the indicators don't hint at anything more than that possibility, thus the reason I won't go long any market correlated assets for a bounce, I'm saying there would need to be more of a basing process, an unwind of the very bearish action, which is ironic, because Investor .com had the highest bullish sentiment seen by our resident sentiment follower as today began!!!

TF futures are still building in to the close, not ES or NQ though. The 5 min divergences in the averages are the same.

VIX futures have a slight negative to them.

All carry trades have been lateral all day which is a big difference from the new lows of 2014 put in overnight, that is a somewhat bullish development so it seems there's a lot of panic selling and TICK verifies this.

Yen and USDX are flat as well. Sentiment indicators are either in line or slightly positive and Yields are slightly positive for the market in to the close.

That's the gist of it, unless there's a fundamental surprise, I don't see any "V" shaped bounce, the most likely thing would be lateral trade early next week that may give us a bounce, but I think it needs to end before the end of the month or just after as China faces some defaults that will spread contagion.

All of the negative signals we have been seeing, this is just the start of the result of those, no support, distribution everywhere. This is ugly, but in the big picture, it's nothing.