Thursday, February 5, 2015

MCP Update

This was yesterday's MCP post, it describes essentially what happened, what we'd like to see happen next, etc, MCP Closing Update.

As for today, MCP is showing some productive signals, although I wouldn't call them the kind of signals I'd enter a new trade on, but moving in the right direction so far.

A consolidation, whether it be through price or through time is usually more than just a 1-day event, especially after a move of over 200% in just over a week so several days of consolidation are realistic, it also gives us the time needed to see if the initial improvements seen today continue to develop and turn this consolidation in to a new high probability opportunity.

 The probabilities for additional upside in MCP are still high as this 60 min chart is leading positive. We'll want to see the chart stay that way and maybe even improve, we don't want to see it deteriorate.

 I drew in an additional daily candle on the 1-day chart, at bare minimum I'd prefer to at least see another day of consolidation in the area with a bullish reversal candle or multiple candle formation.

I drew in a Doji Star in yellow which would be an acceptable candle in and of itself, but notice I also drew it so that today's lows on a bullish hammer and tomorrow's on the star form a 2-candle reversal (bullish) known as a "Tweezer Bottom" in which the intraday lows of today and tomorrow are nearly exactly the same. There are numerous other forms the candlesticks could take and still be a bullish signal and it could be several additional days as well and still be bullish, this is just a broad concept of what would be nice to see at a minimum (at least 1 more day of consolidation).

 The 1 min intraday chart shows the negative at yesterday's highs which we had warned about in advance of those highs and today's action shows a relative positive divegrence, we'd want to see this strengthen significantly and lead positive.

The 3 min chart shows the same basic signals of a negative at the highs and a positive tone since on the pullback, again, we'd want to see this continue to improve, the extra time (day +) would give MCP the change to demonstrate that improvement on the 3C charts.

Here the 5 min chart isn't negative today nor is it very positive, it really hasn't moved much. I drew in a blue arrow of the basic concept of what I'd like to see in 3C, some sort of leading positive divegrence, especially in to another day of relatively flat prices.

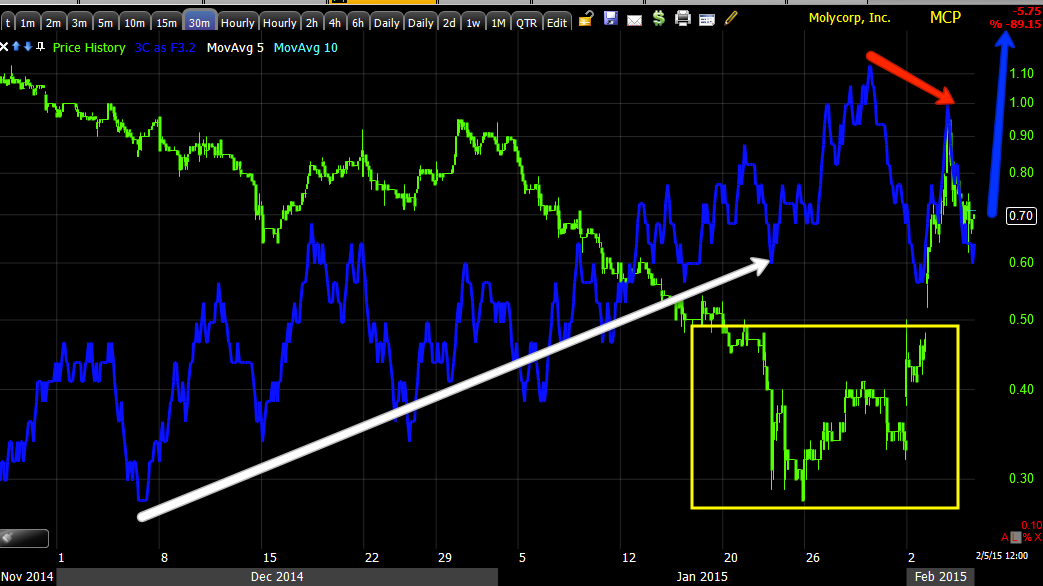
And the same holds true for the 30 min chart which hasn't moved much yet and that's not surprising given the short time we've had since the consolidation, but again I'd like to see 3C move to a more leading positive position and at that point we'd want to look for that bullish reversal candlestick on heavier volume than the preceding day, that would likely be our high probability entry.

These are some of my favorite trade set ups as price and 3C must prove themselves first before you take a position (unless you are holding in which case the 60 min chart is still the highest probability resolution (to the upside).

So far, everything looks pretty good, I'm actually surprised we haven't seen a deeper pullback, but as I said, consolidations can take place through price or through time (sideways).

Strange Looking Market

I'd call this a market update, but I think the title above is more appropriate.

It seems to be pretty clear that there's some element pushing for the green form 2015 theme that was given up yesterday, but as we make that happen this morning, there are some strange looking charts...

 QQQ 1 min

QQQ 3 min recent trend in to today's highs.

And the 5 min that has been in negative position.

 and Index futures intraday are going negative on their charts...NQ 1 min

The SPY has a strange look to it


 The IWM is seeing a deepening leading negative divergence that I've been watching and maybe strangest of all...

Look at the NYSE TCIK, I would not have expected such a flat, tight range in intraday breadth.

Something looks awfully staged or mechanical here.


Opening Update

So far this morning, other than mass loss of central bank credibility , mostly in Europe with the Swiss National bank buying EUR crosses all morning as their soft ceiling for the Swiss Franc fails, and of course the ECB acts as a political power broker in strong arming Greece... it would seem the market is bounce to go green Year to date as it was headed and achieved yesterday before the ECB news came out, that "Green for 15" looks to be the same theme this morning so far, but some interesting cracks are emerging or in some cases have just been in place.

As for Index futures, they were already seeing deterioration which was documented yesterday through just about all timeframes, today as price returns to the scene of the ECB tantrum late yesterday, we have clear divergences developed, these are the definition of a relative divergence ...the same relative area for price, but not the same for the indicator (3c).

 NQ 5 min shows the deterioration that was already in effect yesterday long before the closing hour when the ECB dropped a financial bomb on Greece, you can see as price has returned to the area, 3C is clearly diverging, a relative negative divegrence, in fact it's actually a leading negative divergence, but this is a good chart for the concept of relative divergences.

 The same for other Index futures and longer timeframes as well like ES 7 min

And TF 15 min.

As for the averages, mostly in line in the short term intraday 1-2 min charts, they didn't have much time to fall yesterday after the ECB action so they remain pretty much in the area...
 SPY 1 min intraday appears to be in line, but like the Index futures, the stronger 5 min charts in the averages look like this which is similar to the Index futures.

5 min SPY leading negative as have been all of the averages in the timeframe. Note the reversal process I had drawn in, sorry it's not a great drawing, but I think you get the idea of proportionality.

We'll see where things go from here and I'll have additional updates.

Is it just me or does anyone else feel like the EU is about to come apart at the seams?

Wednesday, February 4, 2015

Daily Wrap

I'm not sure how much any of today's indications are going to mean once the market starts to discount the late, end of day events out of the ECB.

What we do know is we expected Oil/USO to pullback, and while I don't think it's cool to make funny of anyone for making calls in the market as it takes some guts, sometimes I just have to laugh with Cramer just because he's so over the top and because of the reservations I have about him and his loyalities.
After Crude (15 min Brent Futures above) put in a positive divegrence and then rallied 24%, what the media considers a technical bull market, today oil gave back about 11.5% (off the intraday futures' highs) and USO -6.78%  and this just after Cramer smells a bottom and all of the other bottom callers come out as we mentioned yesterday, right in time to be crushed.

The expected pullback in MCP also took place after a potential gain of up to 240%. I know some of you made some decent trades and navigated MCP superbly, we'll see what the future has in store, but like USO, I suspect there's still more gas in the tank after a correction finishes.

Here's what the major averages looked like today as they briefly, finally made it green year to date...
The late afternoon ramp was apparently due to comments from Warren Buffet who said that he thought the F_E_D would have a tough time raising rates given world events. I totally agree with Warren, add in the fact that the unemployment rate is much higher than the headline number (that tends to happen when people who fall off unemployment benefits are no longer counted as unemployed because they are no longer considered part of the work force), additionally the F_E_D would have a hard time given US Macro data which we have talked about and inflation expectations/targets.

However, what I think Warren may have missed is the fact that the F_E_D already put everything in place so they can hike despite these facts, for instance, making the unemployment rate look better than it is (that's really coming from the BLS, not the F_E_D), upgrading the economy despite its obvious headwinds and saying they feel comfortable hiking while inflation is below their long run target so long as they "feel" it's headed in the right direction. Considering they have been wrong on inflation forecasts for 2.5 years, really it doesn't matter, as long as they say they "feel" like they'll be headed in the right direction, they already introduced the concept that they can hike BEFORE inflation hits their target of 2% and similarly, they don't have to worry about incoming data as long as they keep upgrading the economy. For some reason I think the F_E_D has to hike, whatever it is, I'm guessing it is scarier than the damage a rate hike will do to the economy, employment and possibly inflation not to mention the market.

As we correctly surmised last week in USO Update & Effects, the bounce in oil lifted the entire Energy sector which lifted the entire market. The last 3-days Energy has been the leading sector, but as mentioned last night, when this thing in oil heads back south, the opposite effect will take hold.

Of the 9 S&P sectors, today was the first day Energy didn't lead, Consumer Discretionary led with a +.67% gain and Energy was the biggest laggard at -1.65% today (after 3-days of leading Energy still is up 45 on the week). Only 3 of the 9 S&P sectors closed green, a far cry from Monday and Tuesday and of the 238 Morningstar groups and sub-industries, only 78 of 238 closed green, again, easing that overbought condition that was developing the first two days of this week.

However as I said above, I'm not sure today's data is going to count for much because of this...
After hitting green year to date, all of the averages fell back to red on Draghi's effective cutting off Greek bank funding, that's what happens when you play nice and try to work together, they were better off threatening to put a Russian seaport on the Greek coast for bailout funds from the Russians.

In other words, because of the very late day move, a lot has to be looked at again from a new light, a new perspective and a new market discount. I don't think that effects positions like oil and MCP moving forward, but for the market, it could have a very profound effect.

Intraday the SPY and the other averages were going for green YTD on the back of Buffet's comments...
 The 1 min intraday charts were pretty much in line with this move, but when it came down to it and the fragility of this market...

With a little stress, the market moved quickly toward the higher probability 5 min leading negative charts I have shown since this little bounce got started, again, this is why I like to keep my positions in line with the direction of highest probabilities.

Treasuries saw some buying and yields some collapsing in to the ECB action late today...
 Intraday (1 min) 30 year treasury futures lifted in to the close on the ECB action against Greece, but note the overall negative tone of the 30 year's 3C chart, this is right in line with the recent Bond post, Treasury Futures/ TLT Update.

This may take on a different tone as we move forward, but note the negative divegrence that was in place even before Draghi (also remember higher bonds=lower yields=lower stock prices generally).

 We see the same thing in the 10 year, not only the lift of the 10 year bond future at the ECB action, but the intraday negative divegrence, we'll see if that changes now that the ECB has made a new move in the market.

As our post, Treasury Futures/ TLT Update basically concluded, it looks like there's a move toward shorter duration as the 5 year treasury futures also moved higher, but had 3C support, this was the gist or my take away from this post, Treasury Futures/ TLT Update.

As for the Dominant Price/Volume Relationship, it's pretty weak and non existent in some areas, however again since the ECB action so late in the day, it may not be representative of the market moving forward.

The Dow (16), the R2K (831) and the SPX (222) were all Close Down/Volume Down which is the least influential P/V theme, I often cal it, "Carry on" as it has no real next day bias, although in today's case, "Cary on" hardly has any meaning. The NDX had no dominant theme at all.

As for some of the currency expectations from last night, we'll we saw a few, I think maybe the Euro wasn't moving down fast enough for Draghi...
 As we expected, the Euro (EUR/USD) came down, just for other reasons-ECB.

The USD/JPY tried to ramp the market on the open or thereabouts and had no success, then toward the close ES took off without the carry pair, but by Draghi time, they both reverted to the mean on the downside.

HYG underperformed today, you likely saw last night's charts of the negative divergences in HYG which tend to be a great leading indicator, they already took effect in HYG's price today.
HYG (blue) vs SPX today.

In addition, PIMCO's HY Fund started a move down...
 PIMCO HY Fund

And we already know where HY Credit stands...

Still, I suspect a lot could change overnight so I'm not going to expend too much energy on a situation that has clearly become VERY fluid.

I'll likely check Index Futures later tonight, right now they are lower than the 4 pm cash close with a very minor positive divegrence, but it's very minor and 1 min only.

I really expect that today's move, so soon, so dramatic from the ECB is setting the stage for a real showdown with people who feel they've been humiliated, had their dignity stripped from them and now are being backed in to a corner and essentially threatened to get in line or else, as I said 2 nights ago when things initially looked all cheery, "I don't think this ends well for anyone".


Syriza's Weakness Just Made The Global Economy Much More Dangerous

I don't usually do much commentary or news, it's not my thing and you can get it elsewhere, but I think this is important to consider.

Syriza campaigned as the Anti-Austerity party, the party that would end the foolish Troika bailouts that really are nothing more than a conduit for ECB funding as well as keeping European banks and other from realizing massive losses that they've likely only delayed.

On January 26th in the Daily Wrap we addressed to some small extent, the tone Syriza set after winning a near majority in the Greek elections and then forming a coalition governemnet for the few remaining seats they needed for a majority.

The 40-year old Alex Tspiras came out swinging and set the tone early from a position of strength. From the linked post above, here are some excerpts,

"Syriza has campaigned on ending austerity programs in Greece which have been part of bailout deals Greece has received, but put the country through much pain and seeking a debt write down. In a few of Tsipras's first acts as new Prime Minister, he sent a message to the Euro-zone's largest Greek creditor, Germany, by visiting the Kaisariani rifle range where Nazis executed 200 Greeks in May of 1944.

He also had his first meeting with none other than the Russian Foreign Ambassador.

It seems the Troika (and those related) have been quick to send congratulations and maintain and over-concillatory tone from many of the statements I've read from people like Jean-Claude Juncker, the European Commission President; Christine Lagarde- the managing director of the IMF and various Finance Ministers from across Europe. In addition, it seems these creditors are quick to get the word out that they are "looking forward" to "working with" Tsipras on potential redrafting of terms, perhaps interest rates, etc."

That was Syriza coming in to negotiations from a position of strength. I learned many years ago at my first two jobs that strength is respected, weakness invites bullying.

From yesterday's Daily Wrap...

"One of the other major ordeals brewing is Greece. Yesterday's market strength was claimed to be because of some FT headlines about Greece and essentially making progress, in last night's Daily Wrap I refused to go in to any more detail as I knew it would be a complete waste of time and as of today, it's exactly that.

The initial combative Syriza one had the Troika nearly on their knees begging to work something out, whether the Greek Finmin was misunderstood or just tried to be too cooperative, away from the hard line they initially took, it didn't end well and the EU started strong-arming them immediately once they smelled weakness. As a result, today we had this from Greece and their FinMin...

"There has been no "U-turn" on the Greek debt position, adding that "Our promise is solid, debt will be rendered sustainable even if haircut replaced with euphemisms, swaps" Greece’s Finance Minister Yanis Varoufakis comments in Twitter post.

However, that 1-day of weakness may have been too much and too late as Germany calls the Greek plan "Half baked " and reflects it, shortly after the ECB rejects it out of hand as well, that''s what the Greeks get when they try to play ball with the Troika, they were in a much better position when they were combative and meeting with Russia, at that point all of Europe was falling all over themselves to find a solution that works for the Greeks, so this is obviously going to be a knock-down, drag-out brawl as Syriza learns in one day what happens when you try to tone things down and find a settlement in good faith, even if it isn't immediately acceptable on the first pass. Expect things to heat up and Striza to go back to what they know which could lead to...? Yeah, those three dots (...) are the great unknown and the real danger for Europe and the global economy."

I REALLY expected Syriza to "try" to recover from their moment of weakness that the EU and ECB immediately exploited and called Syriza's bluff. As I mentioned last night, in my opinion the 1-day of weakness was enough, that Syriza was not likely going to recover their initial position of strength over 1 day of weakness.

Then today, when I expected Syriza to at least TRY to regain the position of strength they'll need to get anything other than exactly what the Troika tells them they'll get or do, we heard this from Syriza...

Overnight the Greek Finance Minister said that Syriza does not accept the logic of Troika but that does not mean they cannot cooperate. 

When I heard this this morning, I thought to myself, "So much for trying to recover a position of strength and then came the nail in the coffin, the strongest trump card Greece held they gave up for nothing...

GREECE `WILL NEVER SEEK FINANCIAL AID' FROM RUSSIA"

GAME OVER...

Not even 12 hours later... The ECB lifts its waiver on Greek bonds as collateral, effectively ending all ECB funding for Greek banks which likely ends in Greek chaos/bank runs.

More to the point, the ECB has just called any and all bluffs of Syriza and it didn't take the market more than a minute to understand what the two possible outcomes are...
The SPY wipes out all intraday gains from the gap down this morning in a matter of minutes on huge volume as the market realizes there are now only two outcomes due to perhaps the young (40 year old) Greek Prime Minister's inexperience and faux paux of allowing even the slightest hint of weakness...
1) Less than 2 weeks after Syriza won a landslide victory in Greek Elections and was given a mandate to confront the Troika/EU and end austerity, end the unsustainable debt Greece has been saddled with (regardless of fault) and accept whatever terms the Troika gives them, which may have an interesting domestic political outcome as Greeks ushered in Syriza because they are tired of suffering under the Troika's austerity or...

2) Greece exits the Euro-zone and all heck breaks loose in European financials as well as Greece, unless they do get aide from Russia who would love to have a port right in the middle of the Mediterranean.

Either way, the market gets it and understands what's at risk and all of this over 1 day of weakness or even the perception of weakness. Look at what happened, less than 24 hours after their weakness the ECB cuts Greek bank funding and less than 12 hours after burning their trump card (Russia), the ECB does the same and puts Syriza on the back foot.

Ruthless! 


Press Release From ECB
PRESS RELEASE
4 February 2015 - Eligibility of Greek bonds used as collateral in Eurosystem monetary policy operations
ECB’s Governing Council lifts current waiver of minimum credit rating requirements for marketable instruments issued or guaranteed by the Hellenic Republic
Suspension is in line with existing Eurosystem rules, since it is currently not possible to assume a successful conclusion of the programme review
Suspension has no impact on counterparty status of Greek financial institutions
Liquidity needs of affected Eurosystem counterparties can be satisfied by the relevant national central bank, in line with Eurosystem rules
The Governing Council of the European Central Bank (ECB) today decided to lift the waiver affecting marketable debt instruments issued or fully guaranteed by the Hellenic Republic. The waiver allowed these instruments to be used in Eurosystem monetary policy operations despite the fact that they did not fulfil minimum credit rating requirements. The Governing Council decision is based on the fact that it is currently not possible to assume a successful conclusion of the programme review and is in line with existing Eurosystem rules.
This decision does not bear consequences for the counterparty status of Greek financial institutions in monetary policy operations. Liquidity needs of Eurosystem counterparties, for counterparties that do not have sufficient alternative collateral, can be satisfied by the relevant national central bank, by means of emergency liquidity assistance (ELA) within the existing Eurosystem rules.
The instruments in question will cease to be eligible as collateral as of the maturity of the current main refinancing operation (11 February 2015).
 

MCP Closing Update

I'm happy to hear that many of you have had successful trades in MCP, a stock I would not normally cover due to volume/price, but since we have been following it for a while and it does have some interesting features, I have kept up coverage.

We expected MCP to pullback, today it did to the tune of more than -10%, but still up over +150% (as much as nearly +242%) over the last 8 days.

This morning in addition to other warnings, MCP Alert... was posted and MCP ended the day close to expectations.
 The bearish churning observed earlier today was the theme of the day, when you see volume this high which is just shy of yesterday's and no price gains, you can pretty safely assume bearish churning which we saw on a daily basis by 11:30 and an intraday basis. The closing Candlestick isn't exactly a reversal candlestick, it is close to one called "Dark Cloud Cover", but didn't penetrate low enough in to yesterday's real body to be technically correct, but that's where a lot of traders go wrong, trying to be "Technically correct" rather than understanding what the psychology of the charts are telling you which is the most important thing' it's kind of like the difference between memorizing answers for a test and understanding the questions.

 The 60 min chart does show a significant divegrence with no damage done to it today so my assumption unless proven otherwise, is that there's still plenty of gas in the tank and we "should" see a constructive pullback meaning it can be confirmed with 3C accumulation which would make it worth a look as a new long position at the right time, but first it needs to correct which can happen through price or through time.

 The 3 min chart is already showing some positive activity, not enough to call it a buy, but so far it looks somewhat as we expected, a constructive correction.

The same is true of the 5 min chart.

There's a bit of a question at the 10 min chart, but there are several reasons that this chart could look as sharp as it does, this is one we'll want to keep an eye on, otherwise, everything else looks good for another entry sometime in the not too distant future. The great thing about it is the position has to prove itself first, if it doesn't then we can just move on.

USO's pullback

So far as I can see, USO's pullback which was coming, especially after yesterday when everyone including "I smell a bottom"- Cramer, called a bottom in USO, although they were nothing but bearish before Friday, actually looks pretty orderly.

The name of the game will be to get all of the recent "Bottom callers" to reverse course and call it a blip, I suspect it won't be too long before USO can be entered again as there's still plenty of gas in the tank for a move higher.

ECB BLOCKS FUNDING TO GREECE

This is why I always want to stay on the side of highest probabilities in my trades, it's always the thing you didn't see coming that gets you in the market, the unintended consequences and as was just posted Monday, the Greek/Troika negations, at least my opinion, despite Monday's exuberance regarding Greece's new attitude of "willing to play ball" just got ugly as the ECB blocked funding.

More to follow, obviously the market did not like that.

Index Futures Update

As a part of the broader overall market update, I'm including Index Futures.

As of last night in the Daily Wrap... I ended the post as usual with a look at Index futures, this is what we saw as of last night around 7:30 p.m.

"Finally for tonight, Index Futures are not looking great on the intraday 1 min chart which has bled over to the 5 min chart, a lot of the damage was done after the close, but not in all cases."

This is material because the damage we saw last night on the intraday 1 min chart which was a strong enough divergence that it migrated to the much stronger 5 min chart, was more than likely a reflection of the overnight action to come, as you may recall this morning we gapped down off an overnight decline that not even the PBoC's (People's Bank of China)  .5% RRR cut could overcome (see this morning's A.M. Update for additional information/charts).

Thus any migration from 5 min charts to longer chart in the intermediate timeframes like 7 min, 10 min, etc. is also material. While not every Index futures in every timeframe looks exactly alike, there's a theme to them and I chose the best Index future that represented the theme of that timeframe rather than 3 different charts for 7+ timeframes.

 Almost all intraday 1 min Index futures look like this, no discernible trend which is a big part of the reason we've had so few intraday updates, there hasn't been anything to update.

Also consider the lack of movement in the averages especially relative to yesterday or the day before and remember the internals, the S&P and Morningstar groups and the near term overbought condition developing that often ends with the next day close red, this may also be having some effect, along with oil and of course the energy sector underperforming relative to earlier this week.


 TF 5 min was a negative divegrence underway last night, it's still in the Index Futures and has spread to a longer 7 min chart.

 ES 7 min and the divergence is very sharp locally, pretty fast moving since last night's observations.

This has moved out further as you can see with the NQ 10 min chart above,  this is the visual definition of a divergence, 3C contradicting price.


 ES 15 min is showing the same kind of character.

As well as the trend in TF 30 min which may be of interest (as a trend).

And finally the ES 60 min chart, I didn't want to draw too much on an already crowded chart, but you can follow most of the divergences that I highlighted.

This is not a conclusion in itself, it's a piece of the puzzle, but thus far with the market averages deteriorating and Index futures doing the same, we can't ignore the charts.


Market Update

I'm working on putting together a more comprehensive market update. Two things I see right now as influencing factors, one perhaps more immediate than the other and the second perhaps more important than the other, the first and more immediate is the USO and Effects Part 2 or Part 1, basically the effect higher oil prices would have on the Energy Sector and thus on the broad market, so an oil pullback is having an immediate effect on the Energy sector which has led the market the last 3-days.

Perhaps the more important factor is the change in HYG charts as posted in the Daily Wrap... yesterday. The actual divergences are already moving HYG, it's not the divergences that move the market in HYG, they are the "tell" it is HYG's movement that influences the market so with these charts falling apart, it can have a profound effect on the overall market. Many of you know how many times we have called tops and bottoms based on HYG divergences alone before price in HYG even led the market, this is "part" of the more comprehensive market update I'm putting together.

Near term, here's what we have and it seems to be a common trend in the averages...
 intraday action is not screaming anything, it's not all that impressive to me in either direction, although SPY intraday 1 min is in a leading negative position.

Even most 2 min charts aren't that telling in my view, however what is would be the timeframe in which almost all of the averages put in their positive divegrence on a head fake move (many of the averages made a new intraday low for the year on the head fake), this is at the 3 min charts so any deterioration there, where the positive divergences built out to is important near term.

 SPY 3 min with the head fake move (below the yellow trendline) with positive divergences there confirming the head fake/stop run , however the recent dislocation to a leading negative position is deterioration on an important chart for this leg.

 Perhaps more importantly is the stronger, higher probability (stronger underlying trend) of the 5 min charts which have been deteriorating through out the move off the head fake lows, suggesting aggressive distribution in to higher prices as seen throughout January and a lot of December, especially where the Santa rally was expected by most traders.

 Yesterday I showed a 5 min chart of the SPY and tried to express the concept of a reversal process, that we don't usually just get a sudden stop and reversal, but rather a process and I showed a chart similar to this.

Generally speaking bottoms are a bit more narrow than tops, but as you can see, none are "V" shaped reversal events, rather a process and right now the market is looking a lot like it's in a reversal process in the area of our minimum upside target (the breakout above the descending triangle).


 The QQQ1 min isn't screaming anything, although more positive than the SPY.

Again, it's the 3 min chart and the negative divegrence building there and the possibility if not probability of a reversal process in the making.

 Again, the stronger QQQ 5 min chart has been doing nothing but leading negative, suggesting the stronger underlying trend in this small bounce has been aggressive distribution/selling.

 This can even be seen on longer charts, for example the QQQ 10 min. Note the second base in January after the first failed, it is larger (14th-16th) with a nice positive divegrence, but it too failed before it should have as aggressive selling has been ending these bounce attempts prematurely. The current 10 min chart is at a new leading negative low so again, this suggests that selling has been strong, it has been aggressive.

 IWM 1 min looks better than the other averages, but nothing hat I'd be too excited about.

The 3 min chart however is deteriorating, since this is where the positive divegrence made it out to (3 min), the chart /timeframe falling apart is part o the process of a reversal.

Again, the stronger underlying trend at 5 min is no different than any of the other averages, thus we have multiple asset confirmation and even multiple timeframe.

Beyond that, it appears that a reversal process is working itself out, but I am working on a more comprehensive update. As for that reversal process, you'd be surprised how symmetrical and proportional they tend to be vs. the preceding top or base and trend.