Saturday, April 25, 2015

Important Market Update Part 1: The Forecast

Going back to our April 2nd Market forecast,IMPORTANT: AAPL Set-up & Market Movement, in which AAPL was partially used as an example to serve as a proxy for the broad market, I have included some of the most important excerpts from the post. Remember, this was all well before any moves to the upside and we had made some very specific forecasts as to what we'd be looking for.

This is what the SPX looked like on April 2nd, 2015, the day of the forecast linked above.
Looking at the Daily SPX chart from April 2nd, not much is apparent other than a broadly lateral range through most of 2015. I think most would be hard pressed to make some of the forecasts we made bellow on April 2nd based on the chart above.

Some of the expectations and forecasts from the April 2nd post (below) include:

-Market not done in the area which is why there weren't any recent short trade ideas.
-Triangles to form in the major averages as well as a number of individual equities.
-Market & equities to breakout above the apex (point) of triangles.
-Triangles will create head fake moves as a prerequisite for a larger turn to the downside (bull trap).
-Smart Money Would be distributing in to higher prices.
-Past chart reliability gave me little reason to doubt this forecast.
-Probabilities showed that a breakout would be revealed as a failed or false breakout and fail as a head fake move.
-A Head Fake would lead to strong reversal and was a prerequisite to a strong downside reversal.
-Non-Farm Payrolls on Friday April 3rd (the next day as the market was closed for Good Friday) would likely be the catalyst with a print in the mid 150k. Consensus for Non-Farm Payrolls was for a print of +247k, the actual print was way lower at +126k, well below consensus and even the whisper number  of +150k, leading to the start of the forecasted move.

Some of this may seem random at first, obviously on April 2nd when the forecast was made, it was based on probabilities without the benefit of 20/20 hindsight. Still, I'll do my best to put a bow on it at the end of this series. Yesterday's Daily Wrap showed much of what we forecast and expected, however I think I missed an opportunity which I will correct to use the signals in to the April 2nd forecast as an example, rather than the current signals now since we now have the benefit of hindsight to see the signals work as they did previous to this forecast playing out. If you look at the charts included in last night's Daily Wrap post, look at the Leading Indications and 3C signals going in to early April and our April 2nd forecast and you'll see what I mean.

I believe this is the closest thing to actual "Beauty" in the market, it's a moment when everything lines up as it should ("seemingly" totally unrelated assets and indicators) and gives us not only a strong market forecast, but multiple trade opportunities...

I'll be adding additional posts this weekend to pull all of this together in to a tight, neat package.

Now...

Going back to the April 2nd market forecast that got us to where we are now, IMPORTANT: AAPL Set-up & Market Movement...

"I have heard from a lot of members who are short term traders, quick option trades in and out and they have been pulling back and sitting on the sidelines as this bit of a range has been developing.

I first saw what I thought might be a triangle-like range in the broader market, but didn't mention it because I didn't have any decent objective evidence to support that conclusion at the time, but in looking at AAPL, it brought me right back to what I saw in the market over a week ago.

Here's an example...

 Perhaps one of the reasons I didn't mention it is because it's not a well formed triangle as you can see above, but just watching the gist of price action, you can see there's a triangle like structure and I suspect as the range has narrowed in to the apex at the right, this is one of the reasons short term traders have been having more difficulty with positions, the chop is just picking up in frequency.

What is a triangle when it comes to volatility? It's like a Bollinger Band squeeze/pinch in which the ATR (Average True Range) might be getting more volatile on an individual day, but the range in the market is squeezing like a Bollinger band pinch, which is THE PROMISE OF A HIGHLY DIRECTIONAL (MOVE) INCREASE IN VOLATILITY. 

THIS MAY BE EXACTLY THE REASON MY ANALYSIS AS OF YESTERDAY AND LAST NIGHT'S DAILY WRAP FORESAW A WEAK MOVE IN THE MARKET NEAR TERM UNTIL LEADING INDICATORS PICKED UP WITH STRONGER SIGNALS AS THE RANGE TIGHTENS MORE.


This is the SPY's triangle, slightly different in that it's a Right Angle triangle rather than a symmetrical, but neither triangle looks like a true consolidation/continuation pattern, just look at volume which should show a clear trend of decreasing as the triangle matures.

In other words, it looks like a set up for some kind of head fake or Crazy Ivan move....we can guess based on how Technical traders will react and how Wall St. uses that against them to get an idea of what might happen short term and what would be the resolution from there.

Remember as of yesterday we had charts in the 7-15 min range in Index Futures that were more on the positive side than the negative. This was part of our analysis for the near term trend of the market and why we haven't made any strong moves to short in to price strength as the charts just haven't been supportive of that yet, as if the market isn't done in this area.

Perhaps those intermediate timeframe charts are the answer to the Triangle question and what we'd normally assume to be a head fake move to the upside,  which would also be the set up needed to enter shorts that are setting up like GPRO and Biotechs both of which were featured last night in the Daily Wrap.


 The intermediate 7 min ES/SPX futures chart shows the negative divergence from last week that sent prices lower this week as per our "Week Ahead" forecast from last Friday.

Note the slightly positive divegrence in white to the right. 


While the 10 min charts are biased to the positive as well, this 15 min chart of NASDAQ 100 futures (a stronger timeframe and signal than the 7 min charts) shows exactly what happened from last week's negative divegrence coming in to this Monday and sending prices lower this week. 

To the far right we have the same positive divergence seen on the 7 min and 10 min charts of Index futures.

The 3C charts have been very clear as to what's going to happen with significant moves like this week's... I have no reason to doubt the positive on this 15 min chart.

This would suggest some kind of head fake move to the upside of the apex (point) of the triangle which is what we'd normally suspect anyway just on a conceptual basis and our observations of the market.

But how do we know an upside move would be a head fake (A failed or false breakout)?
We simply look at the charts with the strongest signals and highest probabilities... The 30 and 60 min charts are close to inline which means they don't have this positive divegrence that the 7-15 min charts have, this also means that if the divegrence (positive) from the 7-15 min charts is not on the 30 and 60 min charts, it's not that strong, thus the upside move can either be expected to not be that strong or more probable to fail just based on the 30-60 min charts, but these are not the charts with the strongest signals or highest probabilities, these are:

 ES 4 hour with a very strong and obvious 3C leading negative divegrence right in the area of the triangle price pattern.

And the strongest underlying 3C trend, the ES/SPX futures daily chart with an incredibly strong leading negative divergences telling us smart money has not only been selling, but selling at a pace we haven't seen on a long time if ever, despite the negative divergences we have seen up until this point.

To recap:  We have a triangle like price patterns and with it the promise of increasing volatility. Low day to day volatility has made short term traders' lives very difficult to the point many are just stepping aside for the moment. With that triangle we have the 1 thing we were looking for to start increasing as a prerequisite to a strong move down, that is higher volatility and we have seen that on daily charts as I pointed out yesterday, just on an intraday basis rather than a day to day trend basis. The things we have been looking for and the things the market needs to make a strong break of the 100-day moving averages that have been acting as support are set up right now with these triangle like prices and the intermediate (slightly strong) charts suggesting a head fake breakout (something else we'd need to have a strong reversal to the downside as it creates a bull trap).

We also already have the highest probability resolution of any move to the upside, above the apex of the triangles in the averages and that's the 4hour/daily charts.

We also have the same on the charts of the averages...

The QQQ 4 hour which is a very strong chart, in fact so strong we usually never had to use these, 60 min charts were strong enough to forecast moves, but as you see there's confirmation of the price trend as 3C moves with price until we get to the October lows which were a break of an important trendline.

...this is the highest probability resolution to any short term move, meaning any upside move that perhaps breaks above the triangle's apex is already showing extremely high probabilities of failing making it a head fake move.


If tomorrow's Non-Farm Payrolls come in significantly below consensus and in the mid 100 thousand (150k) level (*Which it did at a mere 126k*), I think the chance of the F_E_D putting a rumor like QE4 or something else extremely dovish and extremely ridiculous, could be pretty high, it also gives us the move that we need to sell short in to strength and the volatility we need for the move down to break the 100-day moving averages and challenge the October lows.

Now, lets see if we have the signals in AAPL to make this theory a probability...
Looking at the trend for the short term 3 min chart, the timeframe that steers short term price movement, note the negative and positive divergences, at first you may not notice anything, but if I take away 3C and just show you the exact same chart with price only you'll realize something...

And that realization is...That triangle in AAPL is no coincidence or random price pattern, it was created, just look at the divergences above sending it lower and higher to create this triangle.

Friday, April 24, 2015

Daily Wrap

Since the lovely Andrea will be gone for a few days, I'm going to cook her dinner as she leaves early tomorrow morning. Being that I have the weekend with not much going on, I'll update the Daily Wrap as well as Trade Set-up/Ideas.

However you should know that as of our April 2nd market forecast which was for a head fake (failed breakout) above all of the triangles that were in the market at the time such as this AAPL which was used as an example and proxy for the broad market...

 AAPL's triangle with the April 2nd forecast for a breakout above the triangle's apex in what would be revealed as a false breakout and lead to the next pivot, a larger primary leg down, likely moving toward and below the October lows (not all at once of course).

So far the forecast has been right on.
 We also saw triangles in other assets and averages, some where symmetrical, some were 90 degree like this ascending triangle in the SPX. You can see our April 2nd forecast date in yellow and the breakout above the triangle's apex finally just the last 2-days.

Or the NASDAQ 100 with a descending 90 degree triangle. The April 2nd forecast date in yellow and the breakout and what I consider to be a valid, official head fake move, this is what I said was missing in yesterday's Daily Wrap, the emotional component which forced a short squeeze as seen in an earlier post today-THAT'S THE POINT OF A HEAD FAKE MOVE, TO MOVE EMOTION AND CREATE MOVEMENT IN THE MARKET SUCH AS RETAIL CHASING, WHO DO YOU THINK IS SELLING TO THEM?

In any case, I laid out the 3 different indications I'd be looking for to tell us when this move was coming to an end as a head fake move it was expected to fail the same day the upside forecast was made, April 2nd as probabilities of long term charts showed us that any upside move was almost certainly going to be aggressively sold in to.

The 3 elements were the 3C charts of the averages going negative, specifically out to at least 15 min charts and/or longer.

The Leading Indicators to give a clear dislocated/negative signal vs the SPX

And Index Futures going negative from 7 mins to 15 mins.

As of tonight...Leading Indicators are where they were expected to be almost a month in advance...
 The custom indicator SPX:RUT Ratio and it's failure to confirm the SPX in green.

On a longer trend basis since 4/2, note the leading positive divergence in the indicator in to a "W" base in the SPX, this was part of the analysis that led to the April 2nd forecast. However, since then, this indicator that has been exceptionally accurate for us has had a total failure to confirm the SPX above, THIS IS THE KIND OF LEADING NEGATIVE INDICATION I WAS LOOKING FOR AS DEFINED NEARLY A MONTH AGO.

HIGH YIELD CREDIT WHICH WAS SUPPORTIVE OF THE MARKET, recently has seen horrible 3C negative divergences suggesting ti would start to fall apart and act as a leading negative signal, as you can see, it has diverged from the SPX as well.

Index Futures...
 For the first time in a month, EVERY TIMEFRAME IN ES SPX FUTURES IS NEGATIVE, A "FULL HOUSE".

Again, EXACTLY what I was looking for....

And the averages...
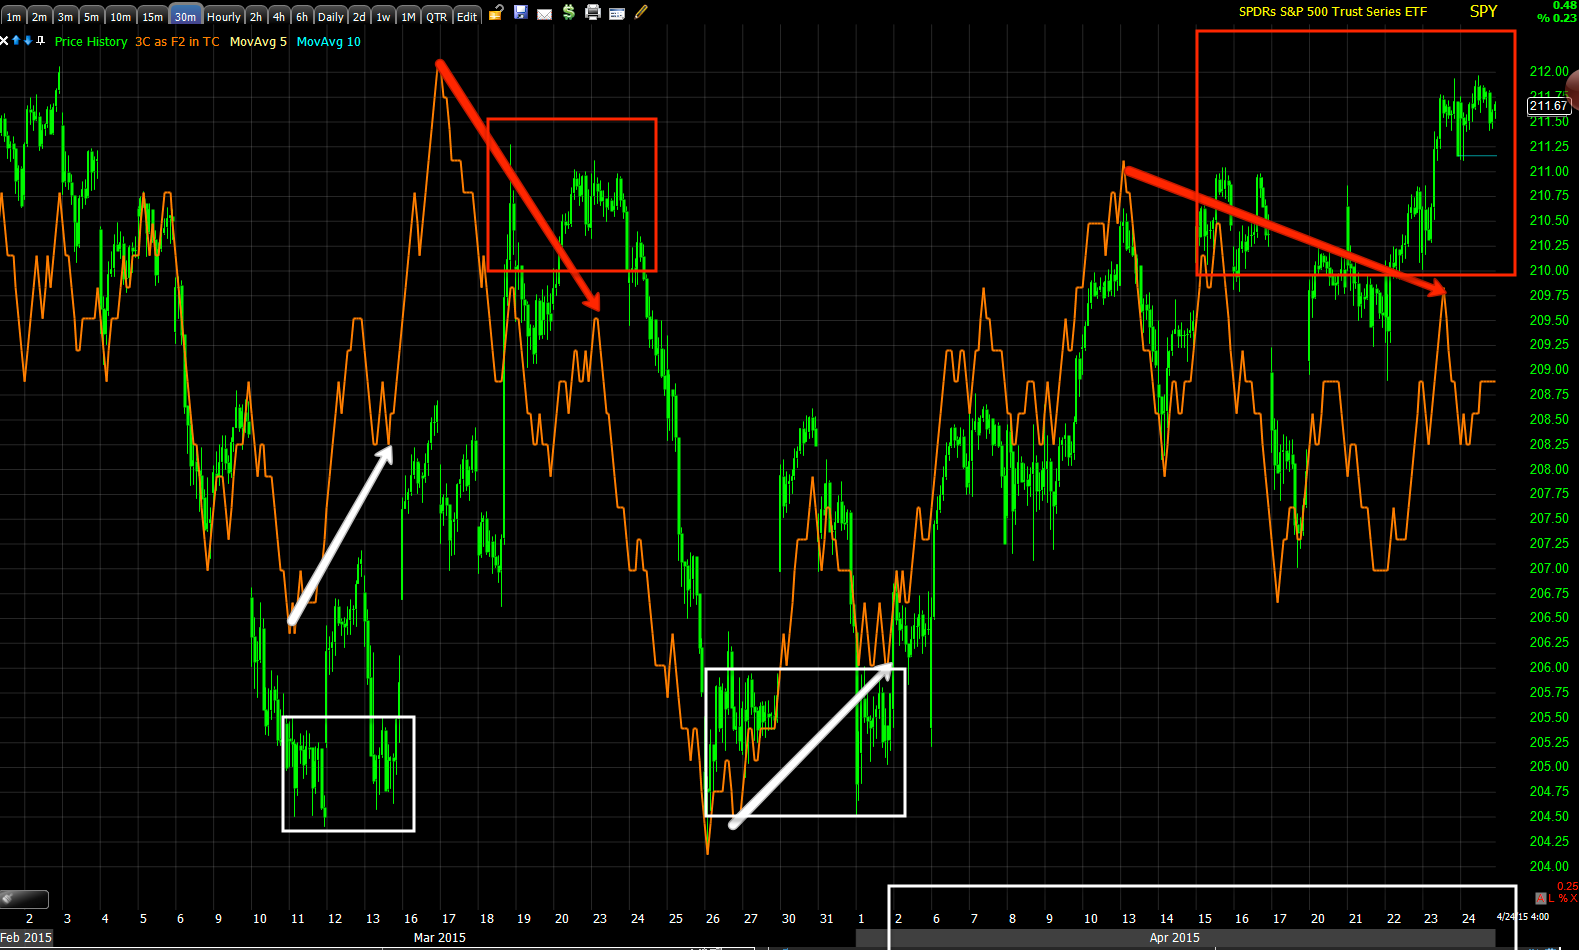
SPY with the April 2nd forecast and trend since in white on the time axis with 3C showing a large negative divergence. Note the positive divergence going in to early April like our Leading Indicator above showed at the exact same "W" bottom.

For the first time in almost a month, EVERYTHING I have been expecting to see on this move including the move itself and head fake as seen in the NASDAQ today, has occurred, I have no reason to believe that the rest of our forecast leading to the next leg won't be equally as accurate.

Have a great weekend and I'll see you soon.


MCP Follow Up

Here are several recent MCP posts/Updates so you can get up to speed if interested. I normally don't cover stocks this cheap, but we have seen something in MCP's 3C charts for some time, something that said "Something is going on here" and as I always say, "With 3C we can see what money is doing, but by the time we find out why, the chance to make money has passed".

In this case it was a 10-year deal with Siemens which sort of puts all of the Seeking Alpha articles about the company's imminent demise out to the pasture if Siemens is willing to sign a 10-year contract for rare earth metals. I suspect this may be what was in the pipeline causing those persistent 3C accumulation signals.

In any case, recent posts:

April 15th, MCP "Patience Pays?"

April 22nd, MCP Update

April 24th, MCP Position Update

MCP closed up +17.86% just a couple days after our Wednesday post showing accumulation in to the consolidation/pullback off the near +100% mid April 2-day jump.

Today's update from this morning is the last one, April 24th above. As I said, "As soon as we can get this in to a Trend Channel, I'll post the stops".

As of the close, this is what the charts look like for MCP...
 Today's Daily chart with a close that has a little too long of an upper wick on its candlestick for my liking, especially on that volume, it suggests some churning, although I think we may be ok in this case for the moment.

As I think I made clear, I have little doubt MCP breaks out from the large "W" stage 1 base and moves to stage 2 Mark-up. I'm just not convinced it's on this leg without a consolidation together a head of steam,  which would make for a beautiful long or add-to entry.

 The 3 min 3C chart shows some profit taking which isn't surprising with double digit gains and going in to the weekend, I think we can let that slide.

The 5 min chart was clean and accurate enough to call the 4/16 highs as seeing distribution, today it's in line so I don't have immediate concerns about MCP's upside as the 5 min chart is in perfect confirmation (green arrow area) today after a significant positive divergence on the consolidation pullback.

 This 30 min MCP chart shows significant "Gas in the tank", however it isn't a particularly large divergence in terms of time, but it makes up for that in intensity on such a strong timeframe. (The longer the timeframe, the more significant the underlying money flow).

 It's this 60 min chart that has me a bit concerned that MCP stalls at base resistance, that's where it did last time in forming the top of the "W" to the left, although there was a very significant positive divergence/accumulation at the second low of the base which by the way saw a head fake move/stop tun under the yellow trendily, as usual, just before a trend reversal (to the upside). This is the same concept we are dealing with right now in the broad market. As I have said dozens of times this week alone and thousands otherwise, a head fake move is one of the best price-based indications we have for timing a reversal as they happen about 80% of the time in every asset and every timeframe as you can see above by the shorter 60 min timeframe and much smaller trend area to be reversed (lows). The more obvious the head fake trigger such as resistance/support, a triangle's apex, etc. and the more popular or watched the asset, as well as the bigger the trend to be reversed, the higher the probabilities of a head fake move which already stand at about 80% even for a small trend change in a little known stock like MCP at a small support area.

 It may be a little premature, but for a wider stop, I have set my Trend Channel at 60 mins. This is the first indicator I won an award for and it self-adjusts to each assets individual volatility and creates a channel around that. If volatility changes, the Channel changes with it , not quite like Bollinger Bands, but not at all like an envelope channel. I apply a certain standard deviation to the channel and if that is broken, then we know that something unusual has happened and a change of character like that will lead to a change in trend, thus we stop out with an objective stop system that doesn't require guessing as to when / where the move is over.

Currently the 60 min which I prefer to use on a close or at least the close of a 60 min bar is at $.89.

The channel will keep locking in gains, even if MCP were to consolidate laterally here, in fact the channel will often hold a healthy consolidation without stopping out.

For a tighter stop, the 30 min Trend Channel has held the last 2-days of gains and is at $.92. As the trend becomes more developed, we can apply a wider channel to allow for normal consolidations and capture as much of the trend before the choppy/volatile top which rarely gives better gains beyond a lucky guess, this is meant to capture the meat of the trend, not to stop out at the high, 3C is better suited to that and I use both in conjunction.

If you need an updated Trend Channel stop, email me. We will likely also be able to put it in to our X-Over Screen/system that will tell us where the most likely first pullback will be and whether it's healthy or not, we just need another day or so.

For now, until the 60-min chart has time to catch up, I would assume resistance at the base's trendily, but I'll stay on top of it, feel free to email me with questions/chart requests for MCP.

Wall Street Under the Covers...

A quick, simple look at the Index futures for the SPX, NDX and Russell 2000 reveal something that would seem to be interesting, however it's often the basis of many of our trade set ups.

With SPY at a mediocre close of +0.23%, the IWM at a lagging close of -0.33% and the QQQ at a leading close of +1.36% I suspect you could imagine what the underlying action would look like in each of the averages based on their closing prices. Remembering that Wall Street's orders/positions are so large, if they were to place them at once they'd crash or drive an asset up in a way that would have regulators screaming Flash Crash or Ramp Job and likely put their position (even if highly profitable) at a loss. In other words, unlike us, they can't simply place an order for a position and be done with it, it's a process and there are specialized, predatory HFT's that look for their orders, better known as "Icebergs" so they can front run them and nail it to the large institutional traders.

Back to the point which is the point of a head fake move whether running below a very visible support level and triggering a boat load of stops to pick them up on the cheap without anyone every wondering "Who took the other side of that trade?" Or in a head fake move/false rally, causing a breakout above a very visible technical area that traders have been conditioned to react to over a century so there's demand to sell or short in to (both actions come across the tape as a sale). You just have to keep in mind, Understanding the Head-Fake Move... Motivation


Take the ES/SPX Futures...ES on an intraday chart...
 ES/SPX futures intraday. The SPY barely moved today at a +0.23% gain. The 3C chart of ES is nearly perfectly in line with price action, no significant institutional action was undertaken here.

TF/Russell 2000 Futures. The IWM closed at a loss of -0.33%, pretty hard to sell in to or short in to in any size, so what do you need to do to be able to sell or short in to demand?  While a minor divergence, interesting that it is positive given the IWM's losses today as compared to the next chart...

NQ/NASDAQ 100 futures, The QQQ close up +1.36%, note the difference between this 3C chart on the very same timeframe vs. the two above,  this was the only average that gave institutional traders demand, price strength...SOMETHING TO SELL IN TO and it appears they did just that.


The Week Ahead

After having surveyed the market today includin and leading indicators as well as stock specific trade ideas, I believe the reversal process will be Time fairly well with next week's F_O_M_C meeting. The timing of this move getting one last pop off before the FOMC is a little more than ironic.

There are numerous trade setups that look good some look great, But as I said with Apple in my view most look like one more day would be the safest route unless you are considering the larger trend and willing to have a wide stop, And then I think anywhere in this area is fine.

Almost all of our leading indicators are not only negative negative but they're -in the way we wanted to see them this includes the SPX:RUT Ratio, professional sentiment, high-yield credit, the VIX is out performing on intraday basis and VIX futures are showing accumulation and treasury yields look as they should with a turn to the downside.

I believe we have our head fake move in, there's nothing new or interesting about the reversal process even on a one-day move like the QQQ today.

This weekend I will be putting out a list of trade ideas ideas which is unusual for me on the weekend, But I believe we have the time and I believe it is worth taking the time to do it right.

And I said this morning I can't predict the exact top to the hour or day, but when the market is at the area, The signals are unmistakable.

So far everything we expected to see since the April 2 second forecast has occurred. This in large part is due to the higher probability that trumps even a move such as the one we have seen since April 2.

I'll have a little more for you after the close and of course over the weekend

AAPL Market Proxy

Coming full circle back to where it began on April 2 with the analysis and forecast that started with AAPL as a market proxy as well as multiple assets and the averages; all of which were showing some sort of triangle. AAPL just happened to be the last chart I looked at before I felt strongly about the forecast and it had the cleanest looking triangle.

 While the AAPL daily chart shows a triangle, it is too large to be a consolidation continuation price pattern. Large triangles tend to be tops or bottoms depending on the preceding trend. The forecast on April 2 was for these triangles which we're pinching in volatility TC and upside breakout which would be revealed as a false breakout or a head fake that would not hold and eventually fail leading to a larger primary trend to the downside, one I suspect we'll take out the October lows eventually. While I don't have time to go into the particulars of why head fake moves are seen about 80% of the time before reversals both up and down, there is a good reason for it and as I showed several times, none of these triangles are organic as you'll see below. The perfect head fake set up.
.
Furthermore volume on the breakout of Apple's triangle has been dismal.

AAPL 1 min. The trend has turned lateral which is where we most often see strong underlying trade such as the negative divergence today.

 This chart shows a head fake move to the downside, a stock run on huge volume which was accumulated. This is the same concept that holds true for upside head fake moves except they are distributed. An effective head fake move needs a very visible technical  area to be effective. In this case the break of support at the yellow trendline hits stops causing selling which was accumulated as technical traders are very predictable. On the way up from the breakout of Apples triangle there's brief confirmation before distribution sets in.

 This large W base with significant accumulation, in proportion with the following move is right into April 2 forecast which I have marked below on the time axis. Note the in-line three she signal on this two minute chart and as Apple makes a break out high, the distribution of those higher prices. This is effectively what the entire April 2 forecast was about.

On a five minute chart we have another smaller W bottom and the actual breakout from the triangle with an initial confirmation as you don't want to kill the baby in the crib as you need higher prices to sell into, the current distribution should be clear.

 This very strong 15 minute chart shows the W bottom and its divergence once again. There are only two small negative divergences and both are within the triangle. I made the case on April 2 that these triangles were not organic they were formed. Compare the price and 3C levels at point A and point B.

 On this 30 minute chart I can mark multiple small negative and positive divergences through the area of the triangle, these were used to create the triangle which can be seen in a number of assets as well as market averages.. As I said, technical traders need something familiar that will cause them to act and Wall Street has there number as they have not changed the basics of technical analysis and its dogma for nearly a century. That's predictability that's easily used against technical traders.

The 30 minute negative divergence is the focus of this chart on Apple's breakout from a large, clear triangle.

While I'm having some trouble with getting my indicator to scale all the way out this is a four hour chart with an overall very negative sentiment.

Apple has earnings on Monday and I usually don't like trading earnings unless there is a very strong edge, if I consider a position in Apple it will be Monday before the close.  I suspect there may be a position opened Monday.

Intraday Market Update

So far, while being an interesting day in seeing the QQQ make an anticipated or expected price move much more in line with the emotional extremes head fake moves are associated with (as you may have noticed yesterday I was clearly disappointed) while the other averages are acting more like they're engaged in an op ex max-pain pin which should diminish the closer we get to 2 PM.

From a criminal enterprise perspective otherwise known as Wall Street, the most effective use of a head fake is to let the headlines simmer over the weekend with retail traders placing orders Sunday night or Monday before they head off to work. In addition as you know I am not a big believer in a V shaped reversal process. The more "U" shaped (or pick your top) reversal tends to not only be more realistic (as a reversal is a process is rarely an event) , but we get the added and if it of stronger 3C signals. This is sort of a "chicken or the egg" scenario, but the way I see it is distribution continues until prices fall of their own weight and the deeper  3C divergences during this time are simply a reflection of that process.

All in all, everything looks very good for confirmation of a head fake move, Probably about staying on the queue queue queue move today on nothing more than horrible earnings. Point being, the Q's did not move on "good" earnings or any other news. As you know my opinion is they moved on the very common Head fake we have been forecasting for over a week.

As far as intraday charts, it is difficult to see them continue to deteriorate and maintain patience, but that is the edge. However this tends to give us the only confirmation we can get, which is during the move (despite probabilities being very strong long before).

Again I'm dealing with short-term charts so there may be some difference since I've captured them. I've tried to add in a few different multiple time frame perspectives.

There are so many charts, I will not be able to comment on all of them with everything I have to do today, but I will put the asset and timeframe

 TICK remains very mellow today, Actually quite negative considering.

 DIA one minute intraday

 DIA 1 min trend

 DIA 5 min trend. Compare and contrast the size of previous local divergences versus the leading divergence around the two horizontal red arrows.

 DIA 15 min trend, the leading negative signal started around the time of the reversal process, the igloo portion of the Igloo/Chimney price pattern.

IWM one minute shows how boring intraday trade has been. Yes there have been intraday steering divergences, but they have been very mellow.

 The more important chart, IWM 2 min trend

 IWM three minute trend since the early April forecast. The green arrows denote 3C confirming price action.

 On an intraday basis, I would like to see migration to charts like this five minute. Once this is leading negative on intraday basis I'll feel better about throwing out a lot of trade ideas what I suspect I'll be spending my weekend doing.

 I WM Long term 15 minute trend from a base to mark up and obviously intense distribution.

QQQ two minute leading negative . I've been watching this closely today however with Apple earnings on Monday and the ability to have a market headline out over the weekend, I suspect it won't turn today.

 QQQ five minutes the kind of intraday deterioration I'd like to see. I drew in a V shaped reversal, this is not a common occurrence unless there is a fundamental event that the market did not foresee. This also gives us more time to confirm and enter the appropriate trades. It is surprising how many individual assets will show the exact same signal as the broad market when we are at they are ready to turn such as the one we caught at the exact top on February 26 after the NFLX earnings-based gap. We set up the trade in what we were looking for a month in advance and had to wait a month for the exact signal but entered at exact high to the day.

 QQQ five minutes relative negative intraday

 SPY one minute intraday, again nothing exciting

 SPY 2 min with the yellow arrow acting as the trendline and yesterdays 11:51 AM break out with distribution ever sense

 SPY 3 min trend showing the four stages. Remember volatility precedes each new stage, the next is stage 4 decline and certainly have the volatility.