Thus far this year USO has lagged equities, which one might find strange considering the geo-political tensions.
In the red trend lines is the shakeout move, it was pretty strong, but as you can see at the white arrows, we saw a distribution day on a break above recent intraday highs . At the yellow arrow, the bullish hammer candlestick and high volume which often leads to a short term reversal. At the orange arrow, again a break or "breakout" above local resistance, this is again a head fake move meant to cause bulls to buy ad trap them, after a few tests of resistance, USO started back down.
Since that distribution day coming out of the strong move up, we have seen a common theme in the market's (almost all markets that have been generally trending down), we see all the volatility on the morning gap and then intraday we see a rebound, which emotionally makes USO feel a lost stronger then the larger trend which can be seen at the long red arrow. I call this, "Slow Boiling the Frog". You may have heard of this, if you throw a frog in to a pot of boiling water it will leap out, however if you gradually and slowly turn up the temperature, the frog will be boiled. This is what the market action has been like intraday. Thus I'll keep an eye on USO, but will probably be quick to exit the trade if I see intraday trade fading as I don't want the calls to get caught in an a.m. gap down.
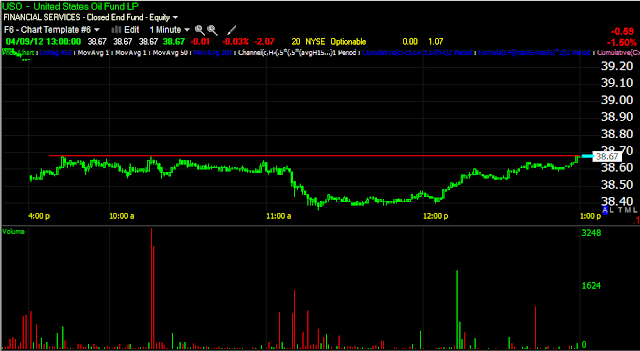
Here's USO at the morning range's resistance, since I put out the first post today on USO it has broken above the range on some volume.
This is what the longer term trend was looking like, there were negative 60 min divergences in the lateral area, leading to the start of a trend of lower lows/lower highs, then a positive divergence, which is the shakeout move. You can see that move lost momentum and has a leading negative divergence in place (don't forget, this is the longer term trend we are looking at). This may not make sense from a geo-political perspective, but we have seen many divergences that didn't make sense at first and only made sense after the money had already been made.
The 30 min chart also shows a deep leading negative divergence on USO's distribution day as it broke to new local intraday highs above the white trendline.
The 15 min chart has more noise and more detail then the 30/60 min charts, but again, a negative divergence on the distribution day, some positive divergences sending USO higher that saw distribution and a general trend lower. Recently we have two relative positive divergences and a leading positive divergence today in the white box; this is why I took on the USO calls. As of now I'm expecting a multi-day bounce, but if conditions change, so will the position.
The 5 min chart shows a couple of positive divergences that have moved USO up, what I'm really interested in with this Call position is USO's break under recent support with a leading positive divergence, it looks to me like the break below local support is being accumulated.
The 2 min chart shows the overall leading positive divergence in the box and a relative positive divergence today at USO's lows.
The 1 min chart DID NOT confirm the move lower today and rather stayed in a leading positive position. This is enough for me to look at USO long, even if only a short play, but as usual, we'll try to take whatever the market offers. As of now, I suspect this is the counter trend volatility to the upside that I have expected over the last month or so and that we have seen pretty consistently.
Obviously if anything changes, I'll update USO.


No comments:
Post a Comment