I was wrong about AMD being positive out to 60 min charts (which is a large, strong divergence), it's actually positive out to 2 hour charts (which is even stronger).
AMD 3 min
AMD 10 min, I don't think this chart needs any annotation.
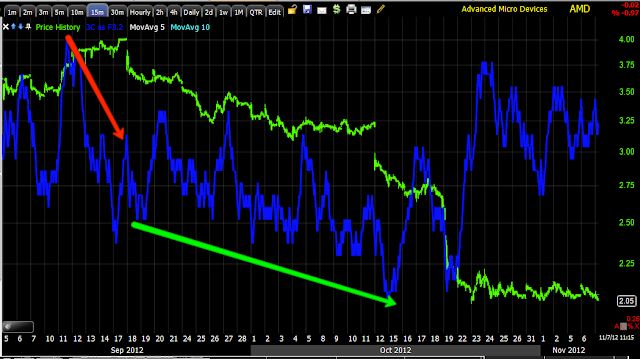
AMD 15 min, I think what's happening on this chart is also pretty clear.
AMD 60 min-the important part is this positive divergence being found in such a flat range. If AMD attracts a lot of attention from longs and they place stops below what is a pretty definable range, then I'd look for a break below that range to run those stops before AMD moves higher, I'm not convinced longs are piling in to AMD and placing those stops.
AMD 2 hour follow price beautifully as there are no divergences on the way down, if there were AMD wouldn't have headed that far down, but in this range something is happening.


No comments:
Post a Comment