As a matter of fact, take a look at how they trade next to each other...
ZNGA in green, FB in red, they trade very much alike, FB saw a recent pump which was most likely because of the options becoming available and the underwriters of the IPO trying to do their job, otherwise they'd probably look nearly identical.
Some other charts...
ZNGA looks to me like its progressing along a base nicely. These bases have a particular look and feel and if you see enough of them you'll start to know what they tend to look like, ZNGA looks like it's around the lows of the base and ready to start turning up slowly before it accelerates up. Why? There wouldn't be a base in ZNGA of FB if someone wasn't creating it, someone seems to be interested in both and chance are very good, especially in ZNGA's case that those groups interested in ZNGA are not done putting their position and tactical move together, they aren't going to let it launch and pay a premium for the stock if they can help it.

Even a simple 50-day (and I'm being generous using an expo m.a.) shows ZNGA starting to round up and likely come off the bottom, that makes for a great low risk entry, but doesn't necessarily mean ZNGA should be up 7% today.
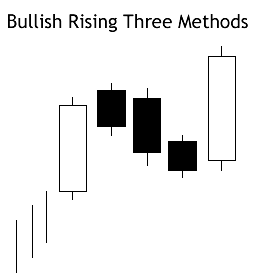
Looking at the trade in closer detail, ZNGA hasn't made a lower low today so today is considered a noise candle or insignificant in the clear method of swing trading which I do subscribe to, but even if it did make a lower low today than Friday, it's still very much within a bullish candlestick pattern called "Rising 3 Methods", here's what it looks like below...
The pullback candles have managed to stay within the body of the bullish up day to the far left, ZNGA is doing the same, it hasn't broke below that up day's body and this is a bullish consolidation formation. Don't get hung up on the 3 days down, it can be 4 or 5, it just needs to stay above the body of the large up candle to the left.
Now longer term, along the lines of a big base, the 2 hour chart shows clearly the negative divergence (leading) taking ZNGA lower and also a positive divergence in building what I can only call a large base for a stock like this.
The 60 min chart has more detail as it should and it looks great, this is the process of building a base or accumulating.
The 10 min chart also shows even more detail, when ZNGA was a bit too high and out of the accumulation zone it was knocked back down to the zone and the positive divergences resumed.
Even on a 3 min chart we see the positive accumulation that eventually leads to a move up and some shares fed out to try to bring price back down to a level in which it can be accumulated according to plan and today we even see some signs of that in to the pullback.
I don't see anything here I'm concerned about, maybe we'll even get a great opportunity.


No comments:
Post a Comment