*The QQQ are now $.06 cents away from the resistance area.
As for the AAPL January $525 Calls, I'm going to treat AAPL as its own trade separate from the QQQ even though it is the most influential component in the NASDAQ 100 accounting for nearly 20% of the average's weight, that's about the same as the bottom 50 weighted NDX stocks combined, so 1 stock can nullify the move of the bottom 50 because it carries more weight than all of them combined!
We are seeing some VERY fast changes in 3C momentum, that sword cuts both ways though. For now I will continue to leave the call position open.
Here's te near term trade, some things to watch for and the longer term trade in AAPL.
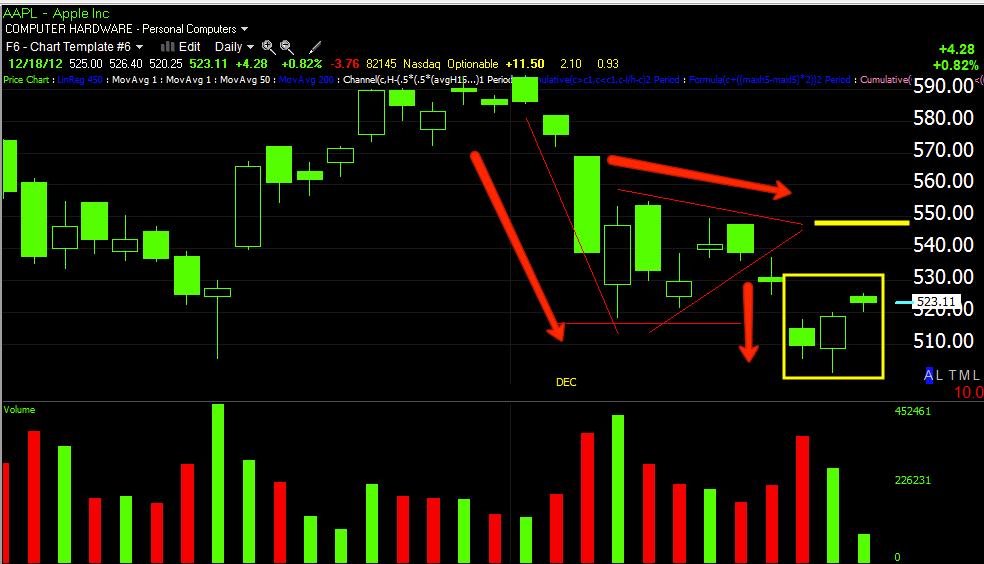
This is the bear pennant in AAPL I covered a couple days ago and if I had time right now I'd include the link, but you should be able to find it in the archives on the right side of the member's site. I said I thought this bearish continuation price pattern that suggests a new move in AAPL as soon as it breaks below the pennant (happened on 12/13) would indeed be a head fake move, it would trap bears and help to create an upside reversal with a mini short squeeze, so far AAPL has done EXACTLY THAT as price is now above the red break down trendline where volume increased so there are shorts at a loss and when/if (I think it does) AAPL breaks above the apex of that triangle (yellow trendline), even more shorts will be squeezed and harder.

Intraday on a 5 min chart there's a bullish consolidation/continuation symmetrical triangle, technical traders trading on these faster timeframes expect it to break to the upside, this is why the chances are good that it breaks to the downside first to shakeout longs and then moves above the triangle, but this is less sure than usual because of the longer term bearish scenario of the bear pennant in transition. Either way, it looks like the triangle will break one way of the other soon.
The intraday charts are negative, but only slightly here. The 1 min above could go negative just to hold intraday upside momentum and create this lateral consolidation, but...
When the 3 min chart is also with a small negative intraday divergence, it suggests probabilities are for a downside shakeout of AAPL.
The 5 min chart has a longer term, larger positive divergence so no matter what happens with the triangle above, I do believe that AAPL will eventually make it' way higher (eventually doesn't mean a long time, it could be in a matter of hours).
The 10 min chart was negative at the top, AAPL moves somewhat like we expected the market to move (although AAPL was a bit sharper on the downside), the market had a few other things in which it could make money (IWM/QQQ break above resistance). AAPL is now starting to show a 10 min positive divergence, it's in and around the area I expected it to hit on the downside before the longer bullish base that has been under development since October, could take effect, so AAPL may be a case of its own, there are many interesting ways to view the end of year trade for hedge funds in AAPL, but I won't get in to that now.
AAPL 15 min chart did make the new low like I suspect/expect the market to make on the downside, it broke below support at the yellow trendline and effected a shakeout, it may not be large, but it was all that was technically needed to get AAPL started back on an upside move that the 30 min chart has shown to be developing for some time.
As you can see we also have leading positive divergence in AAPL right now, so I'll keep these calls open for the time being.


No comments:
Post a Comment