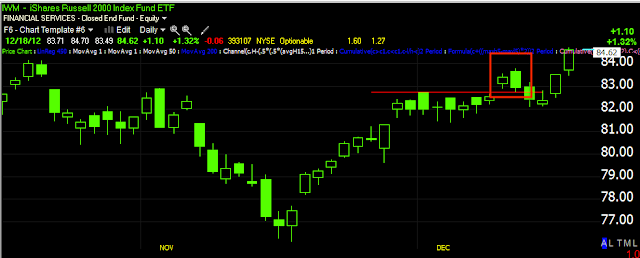
This is why I think we are just sitting up here on top of a parabolic move, take a look at the QQQ charts which has been our target for the market at least since last week when the resistance range became apparent.
QQQ 2 min leading negative divergence
5 min leading negative divergence-remember this was the timeframe that was positive earlier and the one we were waiting for?
Q's are holding the 50-bar 5 min chart, commonly watched.
If they can close the Q's strong and above that resistance range...
Then it's likely the same thing will happen as it did with the IWM, traders who work during the day will come home, see the breakout, place their limit orders and go to work, the market gaps up and sells off the next day, more flies in the web.
Is interest rates about to start going up?
-
Yes, I know - it does not make any sense - FED is about to cut
rates...but....real world interest rates are not always what FED wants it
to be.
6 years ago


No comments:
Post a Comment