I'll be putting together more exhaustive analysis, especially for today, you could literally watch the market react to key words as soon as Bernie spoke them, price would fall, volume pick up or vice-versa, very interesting day.
Here are the Futures for the S&P and NASDAQ, I only use these because you know what I'm looking for (the longer timeframes to shown signs of deterioration with the shorter ones and it's a bit faster to post these two rather than all 4 averages.
I have some small intraday positive divergences going in to after-hours, but they aren't of any concern at this point.
ES (S&P futures) 1 min showing the negative divergence pre-market that sent ES down early in the day, but we weren't going to see too much movement before the policy announcement. Remember I said there were no smoking guns and then suddenly there were some divergences BEFORE the policy statement that told us the market would initially move up, but they weren't so large as to represent anything more than an intraday move. I don't think that is coincidental considering how many news organizations already have the policy announcement sometimes hours before it is released on an embargoed status so they can talk about what just happened and sound knowledgeable without having to spend time going back reading the entire policy directive. It wouldn't be hard for someone to leak an embargoes policy statement and they could be well rewarded for doing it, I can't tell you why else we went from NO signals to a VERY clear signal that fast.
In any case, in to the move up we have a negative divergence, then I posted again about the same volatility ETFs, VXX, UVXY and XIV flipping their signals and the market went down, coincidence again?
ES 15 min is negative which is what I want to see, deterioration among these charts.
ES 30 min shows the exact area we saw the change in the market on Tuesday the 5th and Wednesday the 6th with positive divergences and then a negative divergence since then in to the move which we suspected would lead to some sort of breakout, remember how many times I said, "Wall Street Never does something like this without a reason", breaking the IWM's range and all of the 50-day moving averages seems to be what it was all about. In any case the negative divergence here is encouraging for our trend table.
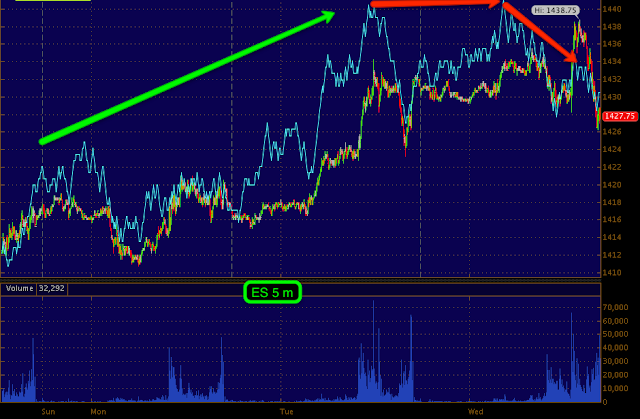
I don't know why, but ES 5 min, you'd see the longer negative trend I think if I had more history on these charts, any way in green ES is in line with 3C or price confirmation, then in red at the two areas we break resistance we have a negative divergence.
NASDAQ
1 min negative pre-market sending the NQ lower early on, a positive divergence around 10 a.m. and the market up in to the policy statement as our other indicators hinted at, this is why it's so important to know the correlations and look at as many indications and assets as possible, you never know where you'll find that piece of information everyone els missed!
15 min is inline until we get our price moves higher, above the 50 m.a.and then negative in to the highs today.
30 min shows the initial trend with a negative divergence far left and that was where we were heading until that positive showed up a week ago at the white arrows, then an in line status in green until we made the price move higher, negative in to the highs today.
Again, I don't know why, but the 5 min out of place, but it shows what we need, a negative divergence in to the highs.
I'll be putting the pieces together, obviously there are some things I really like to add those short ideas here.
Is interest rates about to start going up?
-
Yes, I know - it does not make any sense - FED is about to cut
rates...but....real world interest rates are not always what FED wants it
to be.
6 years ago


No comments:
Post a Comment