For a F_O_M_C day, the market is pretty subdued, here are the charts I told you about. I have a feeling we won't see too much price or 3C movement until the press conference.
DIA 1 min overall leading/relative negative divergence.
1 min close up, not so bad intraday
2 min DIA relative negative divergence.
Overall gravity of the 15 min chart since the start of the move on the 16th with accumulation, now a deep leading negative divergence.
IWM 1 min shows the early, pre-F_O_M_C strength I mentioned earlier, otherwise in line
2 min relative negative divergence.
IWM 3 min with the pre-F_O_M_C positive mentioned and a relative negative divergence.
IWM 10 min from the 16th's accumulation to present leading negative divergence.
QQQ 1 min local trend, leading negative w/ an intraday negative divergence today at the two highs.
2 min local trend, leading negative w/ an intraday negative divergence today at the two highs.
QQQ 15 min since the start of the move on the 16th with a 15 min leading negative divergence, that red trendline is the area I talked about yesterday that should really see a breakout above to complete a head fake move as many traders will wait for price confirmation-the breakout,
SPY 1 min relative negative and intraday
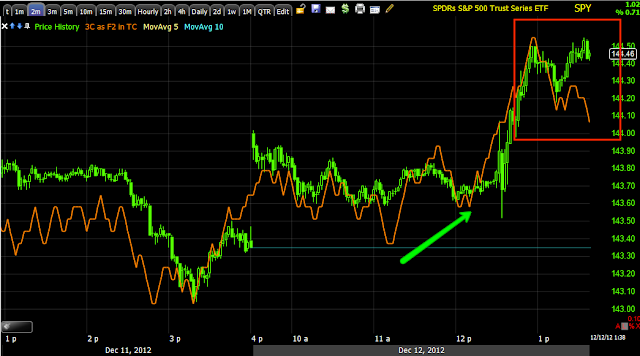
SPY 2 min intraday negative.
Lets see what the press conference brings.
Is interest rates about to start going up?
-
Yes, I know - it does not make any sense - FED is about to cut
rates...but....real world interest rates are not always what FED wants it
to be.
6 years ago


No comments:
Post a Comment