Here are the charts for AAPL which is a great case study for those using 3C or for those who aren't, as long as you can put yourself in the emotional moment of the chart (historical) which is harder to do than you might think and see it from the bull and bear side (imagine you invested all of your kids college fund -that usually helps bring the emotion out of a chart), you can understand the head fakes and why they were used (assuming you have some basic technical analysis understanding like price patterns such as a descending triangle after a downtrend).
In any case, here's AAPL...
Friday the signal in AAPL was solid, it was the profit potential that I had doubts about, this is why Calls were the trade vehicle of choice, we had a good short term signal that wasn't worth taking unless we could make the profit potential worthwhile, a +34% trade for 2 days is not too bad.
A lot of options traders would scoff at that return, but to get their 300% returns, they usually have 90% of their positions at a total loss. We're using options in a different way, not to hit home-runs, although 34% for 2 days is very solid, but to take advantage of strong, high probability signals that don't have the profit potential to make them worthwhile, it's a perfect answer, it keeps us in the green, there are more winning trades than losing trades by far and we are out pretty quickly, this 2+ day position is about the average time for successful trades.
There's a lot to learn about how the market works, how it uses Technical Analysis as handed down over the last century against traders, it shows us how we can use the same in our favor. I went to great lengths to try to explain what was happening and what we expected to happen each step of the way so if you recall, just take a loo back.
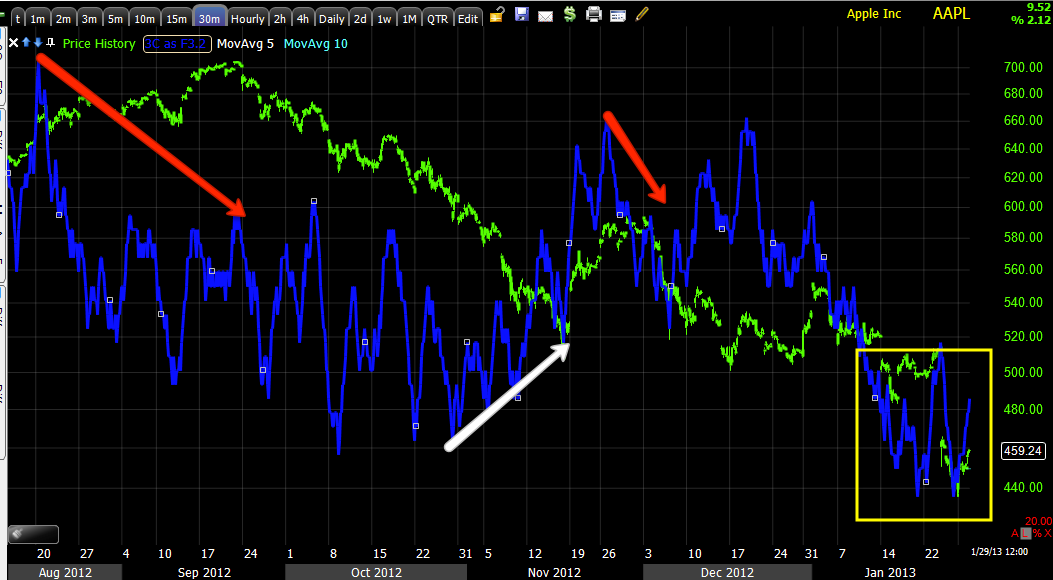
My concern now is we have a fairly solid gap/overhead resistance just above, "IF" this were a price pattern that leads to a new leg down, I'd expect a volatility shakeout above $500 before that move starts, but if this is a longer term trade forming that will see larger upside, then I'd expect a different approach, price would need to come back down near the lows and create a larger base to make a run, the truth is we don't know which way AAPL is going yet as there are several important charts that could tip either way.
For now though, what we do know is the last run (white arrow) had a decent amount of 3C support that this area (yellow ) does not have-at least not yet.
Here's what I'm talking about above, the last run at the white arrow had a decent 30 min positive divergence of some size, we don't have that right now.
Some of the short term strong signals from Friday, as you can see have seen some distribution in to higher prices which was the premise of the original trade idea Friday.
On a shorter 2 min chart, the same strong positive Friday and the same distribution in to higher prices.
The negative divergences are not REALLY scary, so I think the scenario in which AAPL pulls back to form a stronger base is still very much on the table.


No comments:
Post a Comment