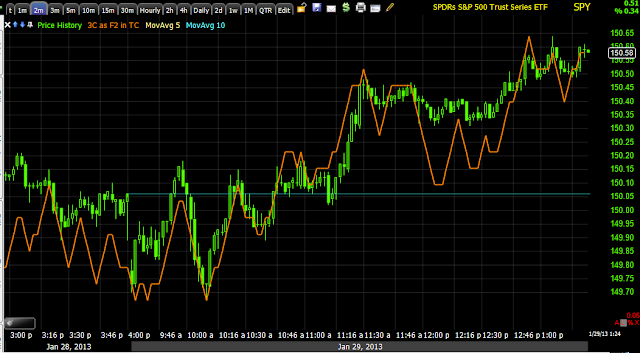
"Using the SPY as an example the 1 min chart has a very clear, pretty deep negative divergence, the 2 min isn't so bad,"
What do I almost always remind you of when there's a 1 min negative divergence, but it stops there? The answer would be that there are two outcomes for intraday trade, either a correction through price otherwise known as a pullback or a correction through time, otherwise known as a consolidation.
Here's a fantastic example from earlier today... Once the 2 min or longer chart/s join the divergence, then it's almost certainly a pullback rather than a consolidation.
This red square is about when I posted the update, you'll see below the 2 min chart remained in line with price and was not negative so the market consolidated sideways through time, a second negative divergence caused another consolidation through time.
The 2 min chart almost perfectly in line with price.
Right now price is getting ahead of the TICK chart so we may see a more substantial correction shortly.
The SPY and DIA are the only two averages that are trending above the 50-bar 5 min chart and in the Trend Channel. Intraday momentum indicators are all turning negative as well so you may take a look at any longs you may be playing intraday and pay close attention to trailing stops and if you are considering short positions, but wanted to get them at better prices, you may want to start thinking about that (although I'm still talking intraday today, not the complete bigger picture).
the 5 min trend is much worse than what you can see here as this is shorter term, but the move up today as predicted by TBT yesterday has almost no support other than FX, by now a 5 min chart could have easily confirmed price action, but there's nothing to confirm, it's a hollow shell being pushed by first the EUR/USD and then its own retail momentum takes over. I don't see heavy distribution in to this move yet, so I'm guessing it's not done, which makes sense as I figured it for a 2 day move with the F_O_M_C tomorrow, I'd think it will run right in to the announcement, kind of buy the rumor/sell the news.

As far as the long term, the momentum in the 30 min chart is what I wanted to show you, but I decided just to show the entire move. The new cycle as you saw today in AAPL and in the past in the averages, had accumulation in front of it as it made a head fake new low at 11/16 that started the cycle. It looked like it was about to roll over until there were hints and then positive divergences that suggested Trend #1, a strong trend up, but much shorter in duration than trend #2 which at the time I expected to take out the 1/16 low, add the pendulum effect on top of that and we could easily have a -20% move in the SPX.
Individual analysis on assets like TLT and TBT as well as the VIX will likely fill out the market picture, don't forget about the declining Leading Indicators that have picked up downside momentum today in the same way 3C picked it up Friday and yesterday.
Look for the other posts coming, I do them separately because the charts change too fast with long posts, but do keep in mind all of the parts, as each part is a piece of the puzzle and when you start seeing a picture, you're probably right about to roll down the hill.


No comments:
Post a Comment