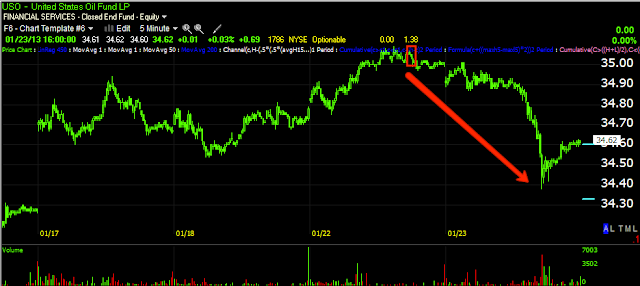
Yesterday there were 3 posts in a row about USO, the first, "Take a Look At USO" was a quick heads up around 2:30 to let you know that USO's charts were deteriorating.
Then, "USO Follow Up" which included some great head fake lessons as well as the charts. There were 7 charts, but this one from the post gives yo a pretty good feel for the deterioration...
Yesterday's chart.
The third post was, "ERY, Energy, USO, IOC" which was a look at USO, the Energy sector, ERY as a play on the energy sector and a core short in place already, IOC. The end result of the post was I didn't think Energy and thus ERY were quite ready, but I did like both USO and IOC short, of course there's leveraged shorts for oil as well among the ETFs, it turned out to be the right choice as IOC was down -4.47% and USO down -1.11% while energy was only down -0.37%.
Here's what the trade would have looked like, at least for today....
USO from the time it was mentioned to today.
IOC -the same...
In the case of IOC it ended with a strong move, heavy volume and a longer lower wick on the daily candle so I wouldn't be surprised if it's at a short term bottom and sees a correction. If you are short IOC feel free to email me.
USO continues to look bad in the near term, don't forget, oil was just at a 4 month new high yesterday so there's still some work to do on the longer charts, but I think yesterday's entry was probably a good place to get your feet wet.
Energy/XLE was also at a 4 month closing high yesterday, it didn't look ready to me yesterday, but things change fast and Energy looks a lot worse today than it did yesterday, however as I often remind, tops/reversals are a process more often than an event, which is good to be in early in the process as it allows a lot of benefits that lower risk and get the best entries.
This is the energy sector and a 15 min chart, yesterday I wasn't so interested, today a lot has changed so we'll be watching these a lot more closely for both long and short opportunities. By the way, this is an excellent example of a divergence, note price is the same at two relative points, the open and near the close as price is close to the trendline representing yesterday's close, note how much lower 3C is (leading negative) at the second move up to that price area. This is telling us that there's less institutional flow in the sector later in the day as compared with earlier.
ERY which is a 3x leveraged short on Energy has a great looking 5 min chart, you might wonder why I didn't like it more yesterday, but there are a lot of thing that go in to analysis.
While it may not appear to be a big deal, the 15 min chart saw a lot of improvement today and this is an extremely important timeframe, so I'm liking ERY a lot more in this area.
Finally there's one larger observation to be made, I have what I call the "Three Pillars", they are the 3 groups that the market needs to sustain a move as they are very influential in the major averages, they'd be: Technology, Financials and Energy. You saw what happened to the Q's today and AAPL tonight, I posted earlier in the day on the deteriorating situation in Financials and now we see Energy deteriorating as well, there's a bigger hint about the market in putting those three observations together.
Is interest rates about to start going up?
-
Yes, I know - it does not make any sense - FED is about to cut
rates...but....real world interest rates are not always what FED wants it
to be.
6 years ago


No comments:
Post a Comment