"A solid rally today and new cycle highs for US equities – but that’s where the story stops.No obvious catalyst. No bullish data. European stocks traded well, with most people pointing to a better German ZEW print, but it’s not clear why that would translate into such a strong US trading session. Maybe it’s best though not to look a gift-horse in the mouth."
Yes, it's far better to leverage up and whistle past the graveyard.
OK, GS was right about a few things for the most part, there was no bullish data, what they left out was there was some bearish data, not only that the Shanghai Composite closed in the red for the second day since the week long Lunar New Year Holiday last week, but the PBoC (People's Bank of China) is (in the articulate words of G.W. Bush-and this is no slam, I spread it all around) "The Bank is turning off the money spigot".
Yes indeed, after 8 months of smaller does of liquidity injections through short term reverse repos, China for the first time in 8 months conducted it's first repo, liquidity draining operation and the reason is quite simple- INFLATION. This is the keyword in F_E_D speak that has the market nervous, "Policy accommodation, blah,blah, blah, WITHIN THE CONTEXT OF PRICE STABILITY", it's the words in bold that have never appeared in a QE program before, which introduces conditionality and even worse, uncertainty. I'm sure you can see how that's much more potentially ambiguous than an amount, a date and that's it.
The one thing US QE (not to mention every other central bank now engaged in the same with currency destruction to boot) has always produced is inflation, in fact it was the US's most significant export to the Emerging Markets and that's why the EM trade everyone talked about a few years ago never got off its feet, inflation and now inflation is running through China so they are dealing with it by draining money from the system.
The US and particularly F_E_D and F_O_M_C members have been quite vocal about it within the last week, some saying that asset purchases should be scaled back, some say they should end sooner than planned, some question whether they are effective at all, most agree they are reaching the point in which the exit from additional purchases at this point will be more painful than any potential good. However most recently the stigma of exiting policy accommodation, which is the really tricky and the most dangerous part is weighing on the minds of F_E_D members.
Specifically some at the F_E_D are becoming more concerned that when they raise rates which must happen at some point, banks like Wells Fargo will stand to make BILLIONS of dollars in interest from the reserves they have parked at the F_E_D and how that will look to the general public after the F_E_D and government spent so much money (real or perceived as real by the public) bailing out these same banks.
In the FT this week, F_E_D members are concerned that interest payments to the major banks that could run between $50 and $75 billion a year, while at the same time the F_E_D takes losses and stops remitting money to the Treasury is going to look really bad. St Louis F-e-d president, Bullard says the interest the F_E_D will pay these banks will be more than the banks' own profits.
The way the F_E_D pays for QE assets is through creating bank reserves that now stand at $1.6 trillion and if QE3 runs its course, it will add another trillion to the balance sheet. If you want to read more about the story, here's the link to the FT.
My point is not so much any one particular story, whether it be from the first moment I realized they were looking at an exit when they changed the yardstick to an economic based one rather than date based; My point is up until several months ago, we never heard anything other than the F_E_D had our backs for as long as it took and they had more tools they could deploy.
In the most recent months since QE3 was announced on September 13th and especially when the minute from the September meeting came out, it has become VERY clear that the F_E_D not only realizes they tried and didn't accomplish much, but they are now contemplating how much damage they are doing and what the exit might look like.
Before September, the F_E_D dare not say anything specific with regard to an exit.
This is why in my view tomorrow's January F_O_M_C minutes are crucial and honestly if there was going to be day to rally the market, it would be today because after tomorrow, lord knows what we will be reading.
Now on to today's market action and some bigger picture portraits...
I'm not going to pretend that today wasn't a strong "looking" day, it was, that's not the point at all and that's not why our recent adjustment to the market has been working so well (short term options in both long and short directions).
Here's the truth of the market, no matter what it feels like, sounds like, what the CNBC headlines or even NBC headlines are...
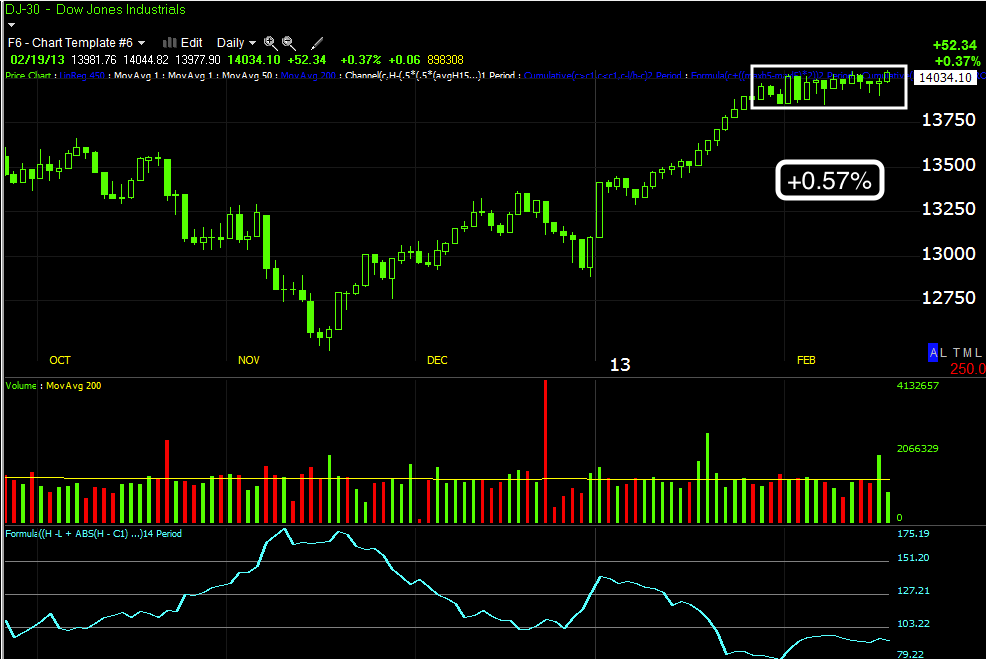
These charts show the major averages and their percentage moves over the last 3 trading weeks with the 15 day ATR (average True Range) at the bottom.
SP-500

NASDAQ 100

R2K

Dow-30
There are recent changes as well in currencies that have been supportive of the market and right around the same time, I peg most of them at Feb 1.


Around the same time, Feb 1, the $USD starts making higher highs/higher lows.
There are a number of other important currencies doing the same, here are a couple of the most important...
EUR/JPY


USD/JPY


As to today's internals, the thing that stood out the most was the Dominant Price/Volume Relationship, which saw 3 major averages all share the same relationship out of 4 different possibilities...


In each case, the component stocks that make up the averages had a dominant relationship of nearly half of the index, the relationship was price up and volume down, out of the 4 possible price/volume relationships, believe it or not, this is the most bearish and often leads to a 1-day overbought condition with the market down the next.
Another event that stood out was the advance of the CBOE's SKEW Index...

With the FX market changes, the Credit market changes, more or less any risk asset except for equities moving toward less exposure or protection, I have no problem keeping established shorts open, sticking with several long positions, some I think will be stronger for longer than others and skimming double digit returns from the market as long as we can so long as the general tone continues to be something like this....

While the masses look at the headlines, "New 5-year high in the S&P and Dow", I'd much rather keep track of reality and reality is these 5 year highs are almost akin to a drift in the wind while the assets that hold a market together all fall by the way side.
I'd think the F_E_D would have been much more careful in their deliberations at the last meeting just as the policy statement sounded, so I'd expect the minutes to be more mellow than the previous minutes, but with all the F_E_D talk over the last week of policy end-game, we might be in for a nasty surprise.


No comments:
Post a Comment