First we are getting that move to the upside in the IWM, other than the hints that were available this morning, here are some additional hints that were warning of the impending move.
IWM continuing positive divergence on a 3 min chart, short term, but that's all I'm looking for, the green arrow is the entry post, so we still had enough downside momentum to make the call less expensive, once volatility dies down the calls become a little more expensive.
The intraday momentum indicators I introduced recently show the TICK outperforming theSPY which is often indicative of a short term trend change and my custom indicator for the TICK is also moving positive on the Histogram.
The 50-bar 5 min average is watched by many intraday/short term traders, we just crossed that and my Trend Channel saw a couple of extremes through the bottom of the channel and then flattened out, this sets the stage for an upside turn.
As for the momentum indicators, at the top the momo indicator has been positive for a good part of the day, RSI has been cooperative, MACD (long setting 26/52/9) has been moving positive and Stochastics which I only use for embedded signals (also long setting 50 period/3) cam undone from the embed.
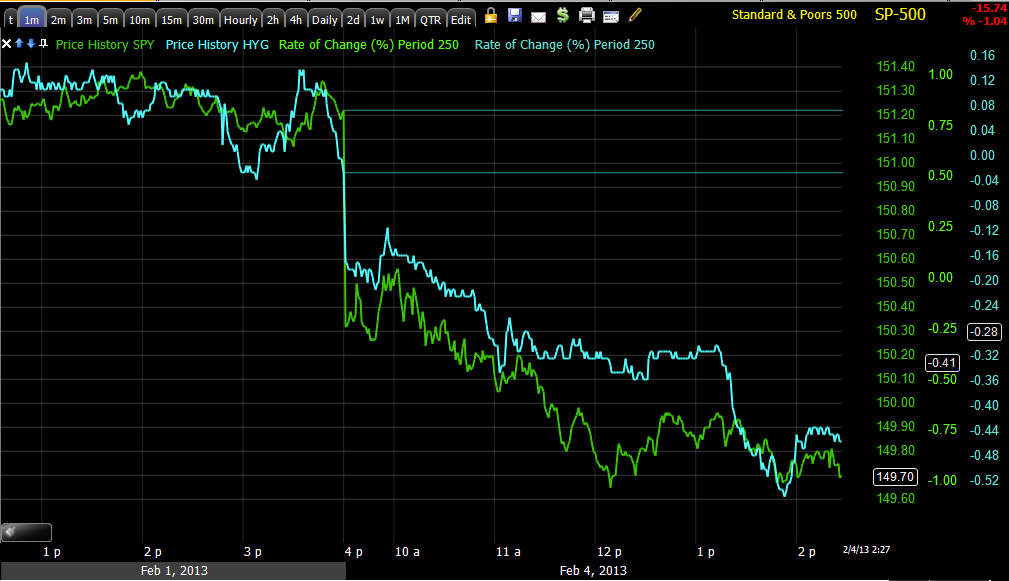
Now what really matters, Leading Indicators.
The Quick and dirty, but effective CONTEXT model for ES shows the model is even lower than ES even though ES has been moving down, this mens risk assets like credit and many others they use in the model are performing worse than ES.
SPY Arbitrage model shows a differential between the model and the SPY of nearly $.60 right now, $.80 earlier, the SPY is overpriced vs the model. This is why we want to sell in to strength.
Our own indicators...

Commodities vs the SPX are performing a little better on a momentum/relative basis.
Commodities are roughly following the Euro which is in green (otherwise the green comparison symbol is the SPX).

Still the EUR/USD has a 1 min intraday positive divergence in place.
This is the Euro vs the SPX intraday, you can see the weakness toward the end of Friday where all the 3C leading negative divergences lined up, today pretty much in line.
A Longer term chart of the $AUD as one of a basket of carry trade currencies shows a risk off sentiment.
FCT which has worked out very well is also quite negative vs the SPX, they usually move together.
Volatility -VXX 2 min shows some very short term trading signals if anyone is interested in those, let me know.Here we see early confirmation of the move up and late and light distribution presumably for the market bounce we are looking for in to tomorrow.

Longer term though, the 10 min is at a new leading positive high, note at the tops there's no sign of any negative divergences.
The 60 min VXX is hitting a new leading positive high, equal to when prices where well above $38
UVXY -leveraged volatility 10 min chart hitting a new leading positive divergence.

Same with the 60 min-
These are bigger picture signals that are showing strong momentum.
Credit has performed like the SPX today, badly.
High Yield Corp. has made a new low that is now below the start of trend #1, this is an extraordinary divergence and I'd be VERY afraid if I was long.
This indicator tries to show the difference in momentum between HYG and the SPX.
Junk Credit also performing poorly today...
Bt even worse, it has hit a new leading low below the start of the bottom of trend #1, and this in 6 days!


No comments:
Post a Comment