If you are more inclined to wait to use price strength to short in to and build out a longer term, higher probability position, then pay attention especially to the ES (SPX futures) charts as well as the IWM charts.
ES-SPX Futures (e-mini)
This is the 1 min chart, it's pretty self-explanatory.
Here'a where there's a change in character, we've been using this 5 min chart the last week or so to predict next day changes and play them on the current day, in white at price lows we would be buying to sell the next day at higher prices and we'd have a negative divergence at higher prices and use puts that day for lower prices the next, well if that pattern continued, we'd be building a positive divergence here based on the 3C charts, we aren't so either the move to the upside has lost probabilities or there's overall bigger picture deterioration which is what I'm leaning toward.
NQ -NASDAQ Futures (e-mini)
The NQ 1 min chart, again, self-explanatory.
SPY
The 1 min leading positive in the SPY, I'd be looking for at least a gap fill.
The 3 min going leading negative Friday and leading positive to a lesser degree today.
The 5 min with a large relative and leading negative in to Friday's price action and in line otherwise, not positive.
The DIA looks a little strange, I have a feeling its because the version of 3C is meant for large caps and is a bit slower, but there's a 3 min relative positive after Friday's relative negative in to the highs, remember what I said Friday about +14k not having any kind of excitement behind it?
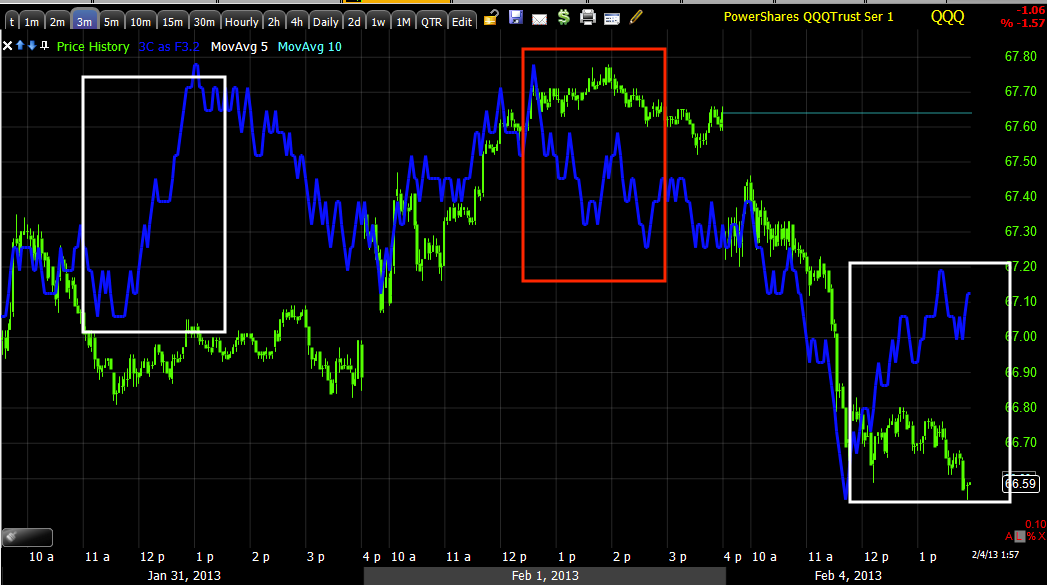
QQQ
3 min positive on Thursday, prices up Friday and turns negative Friday, prices down Today and turns positive, but not nearly as positive as Thursday, this may be deterioration or rotation to the IWM.
5 min QQQ again the same finding as above, Friday's underlying trade was really horrendous, probably should have played some puts Friday.
QQQ 60 min goes leading negative RIGHT at the HEAD FAKE move in yellow, this is where we'd expect to see heavy distribution because the breakout provides the retail demand smart money can sell in to. The positive at the left is the accumulation for the trend #1 move up, which has been sold in to higher prices.
IWM
Again, the 3 min is leading negative, this really probably should have been shorted with SRTY or puts for a short term move, the volatility is here, why not take advantage of it. The leading positive today is pretty strong which tends to confirm my earlier view that the IWM was the best candidate for a short term Call position, around the yellow arrow is when the actual position post came out so there was still decent downward momentum making the calls cheaper.
IWM 5 min leading negative Friday, the positive today barely registers, this seem to be bigger picture deterioration, it seems they want to fill the gap, but are less willing to take on risk at this point to do that.
The 10 min IWM and a spectacular leading negative divergence.
For those that just want to let the trade come to them and focus on the larger position, shorting or selling strength in price, this chart basically suggests loudly, "You are on the right track!".
There's no right or wrong whether you chose to play the shorter trades like IWM calls today or look to use that strength to short in to or are just waiting maybe to buy some long ideas on a pullback, it is what you are comfortable with, what fits your view of the market and investing/trading style as well as risk tolerance.


No comments:
Post a Comment