Other than the parabolic move above resistance with distribution possibly or probably creating a head fake area right there... Here are the charts.
The Daily chart with resistance broken at 11:15 a.m.- Head Fake? It's in a potential Head-Fake area, that plus the 50-day moving average was resistance for yesterday's highs, so at 11:15 it broke resistance as well as the 50-day average, two very closely watched areas on a VERY closely watched stock.
Volume at the 11:15 break
1 min distribution, when? 11:15
The longer term 1 min chart's trend so there's been distribution in to the recent highs.
2 min chart
2 min trend.
3 min chart
5 min chart, I'd like to see this go leading negative, I may consider an add to if it does and the set up is still favorable.
This is the 10 min chart, I'm not thinking a long move, that's why it needs options to make the potential profit worth the risk, stock alone is not worth it for me.
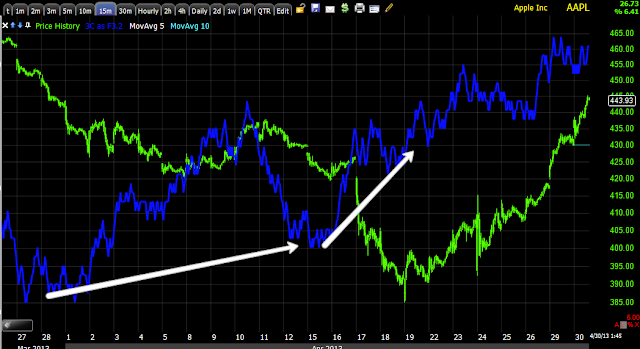
The 15 min chart is still very strong, this is what I believe to be the gas tank essentially for the counter trend move which would be fairly young, the question is whether AAPL and this chart can hold up in a deteriorating environment?
As for the longer term counter t rend rally potential... I encourage you to look at the Dow-30 in detail from 1929 on, don't just look at the chart and miss the important stuff like a 40+% bear market counter trend rally that lasted 6 months shortly after the crash-that would be convincing to a lot of people who were then living at the right side of the chart, unlike us.
AAPL?
3 day chart with a 50-bar m.a. (150-day average) which held well. Notice as I often tell you, "Changes in character lead to changes in trends", EVEN BULLISH ONES AND IN THIS CASE AT THE WHITE ARROW, ESPECIALLY AT BULLISH ONES.
This is the volatility I often tell you about that precedes the end of a trend/the top. If you sold right at the reversal of that increased ROC to the upside, you'd be out at $650 and wouldn't have lost potentially 260 points from there. They yellow arrow is a potential target for a counter trend rally, at the average that has worked so well and at a centennial number-$500.
That's another bridge, another day.
Is interest rates about to start going up?
-
Yes, I know - it does not make any sense - FED is about to cut
rates...but....real world interest rates are not always what FED wants it
to be.
6 years ago


No comments:
Post a Comment