Sorry this post took so long to prepare, but there's a lot of concepts here that you should find useful and this is a short I have been watching and waiting for, for some time and this is the first time in quite a while I have brought it up.
First lets look at the charts...
XLF
First of all, this is XLF's daily chart, I don't know how the candle will close, but this reminds me a lot of the Q1 / April shorts were putting on in 2012 (9 core short positions, everyone at a double digit profit by June with no leverage) when we were letting them come to us, almost every one of them was entered on a head fake / false breakout (for the concepts behind head fakes, please read my 2 part article linked at the top right of the member's site
PART 1 and
PART 2). I remember BIDU very well because so many people wanted to buy the breakout and we were shorting it. A Head fake/False Breakout is marked in a yellow square, we almost always see them right before a reversal (they work on breaks to the downside and upside). This one has broken above clear resistance, the 3C charts, candle's close and volume will tell us a lot, but I suspect it's part of a head fake, it may last more than a day, it may not).
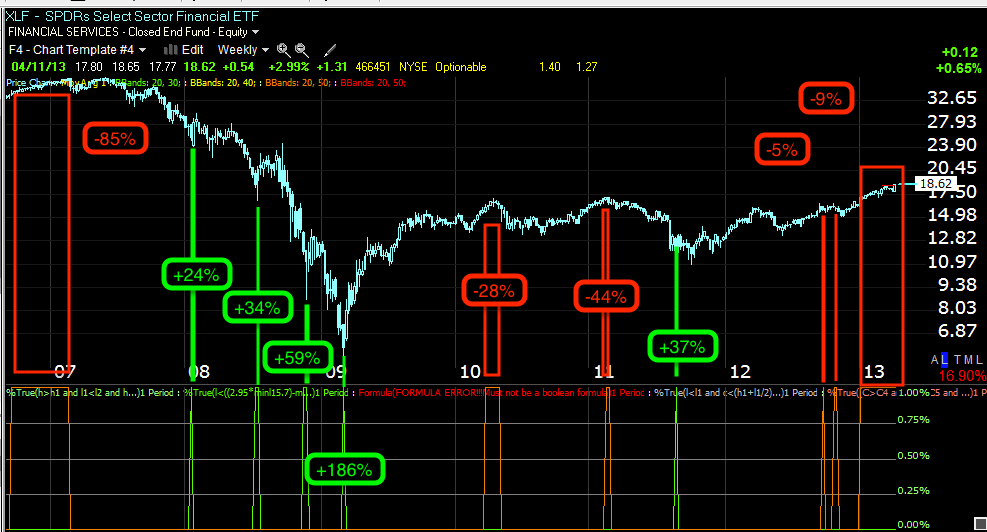
Using my custom indicator based on DeMark principles for buy/sell areas (green and orange respectively) the longer the chart and bigger the signal, typically the more important it is, this is a weekly chart and this is the largest signal since just before the 2007 top.
You can see some of the other signals that don't appear to be much, were actually quite worthwhile. To the left as I often remind you, bear market rallies are sharper and more intense than most bull market rallies because they need to be believable to work, look at some of those gains before the 2009 low.
Click on the chart for a larger view
My Custom Trend Channel (the first indicator I won an award for) is based on concepts of the best trend traders that ever were, the Turtle Traders. Using the 2-day setting as it has held and correctly stopped out multiple trends for XLF, the 2013 break is where I said, "When we look back a year or so from now, that will be the area in which the market's back was broken" and breadth charts I have posted have proven that ever since. The Yellow squares are head fake moves before reversals.

My Custom X-over Screen to avoid false cross over signals did not give a confirmed sell signal like the buy signals in white to the left with all 3 indicators firing (the price moving averages, the custom indicator and its moving average in the middle and RSI at the bottom), however right at the area the Trend Channel was broken (which tells you something bout the Trend has changed and changes in price precede changes in trend), 2 of 3 of the signals on this screen gave sell signals, we also are very close to having all 3 fire, however price will have already moved significantly before they do.

The 15 min 3C chart of XLF shows a Feb accumulation area to the left, distribution at the March highs which also put in a new break out/head fake move before reversing to the downside, the accumulation area for the April run of this week is EXTREMELY small, this is what I was perplexed by earlier this week as algos lifted the market Monday on the lowest volume of the year ex. holidays and Tuesday and Wednesday were both manipulated as 154 trading firms and banks got the F_E_D/F_O_M_C minutes more than a day before they were released.
There's a current leading negative divergence as we make this breakout.
The 5 min chart shows the leading positive in Feb. the negative/distribution at March highs with several head fake moves and the small accumulation of this week as well as a long term relative negative divergence.
A closer view of the 5 min chart shows the accumulation area, it is not the entire white arrow, but mostly the open on Monday, green=trend confirmation and red = negative divergence in to the new high.
Intraday we see a positive late yesterday and a negative as XLF breaks out today.
The 3 min chart for the week shows the accumulation early in the week and distribution with a leading negative divergence now.
FAZ-this is one way to play Financials short, FAZ is a 3x leveraged Bear ETF, meaning you buy it for short coverage on financials at 3x leverage. I favor FAZ for swing trades or in and out type trades.
FAZ has been showing accumulation and a leading positive divergence on a head fake day (below support @ the white lateral trendline)
The 2 min FAZ chart also shows the negative divergences at the start of the week (exactly opposite XLF as it should be for confirmation) and a recent strong leading positive divergence. Look at today's leading activity on a break below support! That VERY much appears to be a head fake/false breakdown move.
The 3 min chart shows good migration of the divergence with a leading positive currently, also big movement on today's move even with a break below support, this tends to confirm the nature of the head fake move.
The 5 min chart has al the same migration of the divergence and is also leading positive, especially today.
10 min chart is very leading positive, the yellow shows the suspected head fake/false break.
I suspect we may have a little time, but probably not long to monitor this and make a decision, you can always consider phasing in to the trade and adding at better prices if they become available, but this must be part of your risk management before you enter the trade, it can't be averaging down.
On the other hand, we've seen quite a few head fake moves that are 1 -day blow-offs.
I'll keep an eye on it as well.


No comments:
Post a Comment