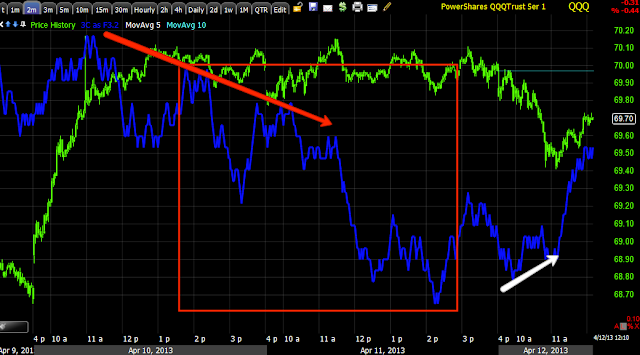
I know some of you are trying to play the long side of this and there are some charts that suggest you can for a while, but I would be remiss if I didn't show you their full context so this is a bit larger of a post than I wanted. I would be looking to sell strength more than anything.
SPY 1 m in line
Larger 1 min chart
SPY 3 min leading negative, not good chances here, in red tops are a process, not an event like the green "V"
Longer term 3 min is at new leading negative lows, be VERY careful day trading this
SPY 5 min is approaching new leading negative lows
QQQ 1 min with a positive and in line, but this is moving fast.
Close up of 1 min QQQ today
QQQ 2 min looks the best
Yet remember this cliff, 15 min chart at new leading negative lows while prices are this high, not good.
Longer term QQQ 15 min chart, does the yellow area around price look like anything to you?
IWM 1 min positive-remember these are not real time as it takes time to put these together.
IWM 1 min in larger view
IWM 2 min
2 min closer view in line
IWM 3 min positive closer view
IWM 5 min at new leading negative lows
This is why I said what I said about the Steam Roller, yes there's always severe volatility at reversals, but big risks as well
IWM 15 min
I would be using some kind of intraday momentum indicators like these, momentum, RSI, MACD and Stochastics set to long 26/52
1 min view w/ Stochastics set to 100
You should also consider ROC on price, if you can't apply it directly, put an invisible 1-bar moving average on price and attach ROC to that, look for divergences in multiple timeframes.
Remember intraday traders watch the 50-bar 5 min chart as resistance and support, be watchful of that.
When you identify a trend on a timeframe, consider a 22-bar moving average as a stop
Is interest rates about to start going up?
-
Yes, I know - it does not make any sense - FED is about to cut
rates...but....real world interest rates are not always what FED wants it
to be.
6 years ago


No comments:
Post a Comment