If it were a matter of starting or adding to a GOOG equity short, I'd probably consider this a decent area. If you really have time to pay attention or are more interested in a put, then I'll show you the area I'd be watching for, I'm just a bit concerned things could happen so fast we don't have time to get in position, but that's really no reason to take a trade that is not optimal, I'll be waiting patiently and hoping this comes to me and I have time to act. With an equity short, the potential drawdown isn't that significant and in my view losing the larger trending trade is more of a risk than a few percent temporary drawdown, but options are much different.
GOOG 60 min shows the longer term flow/ trend- GOOG looks to be in a lot of trouble here.

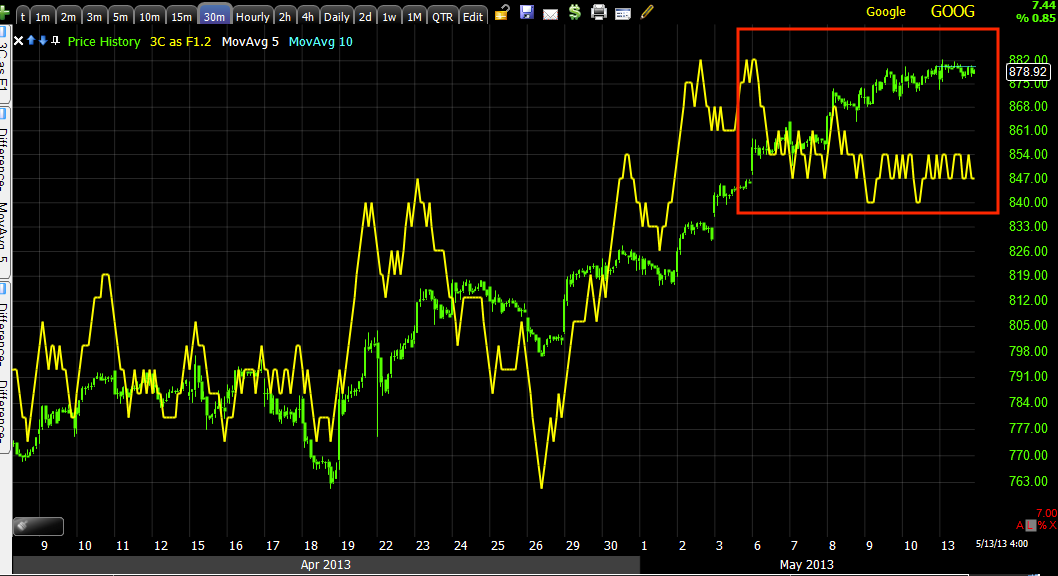
Close up of the 30 min shows that the more recent trade has had more urgency to it.
The 10 min chart's greater detail backs up my thoughts on the 30 min chart above this one.
This 3 min chart is an intraday move, this is the AAPL scenario, the 3 dangers are 1) the move comes and the sellers just overwhelm the positive divergence and there's not much of a move at all, that happened 3 times in a big way throughout the entire market Thursday night, Friday regular hours and last night, the second danger is that it moves so quick that I don't have a chance to establish a position and lastly, that it doesn't move at all, this is only a 3 min divergence and while that would be more than enough to wait with no hesitation for the head fake move above resistance/new high, in this market, much of that is out the window.
I still think for options you have to wait for the best set up or move on.


 | Theme by Thur
No comments:
Post a Comment